Hi!
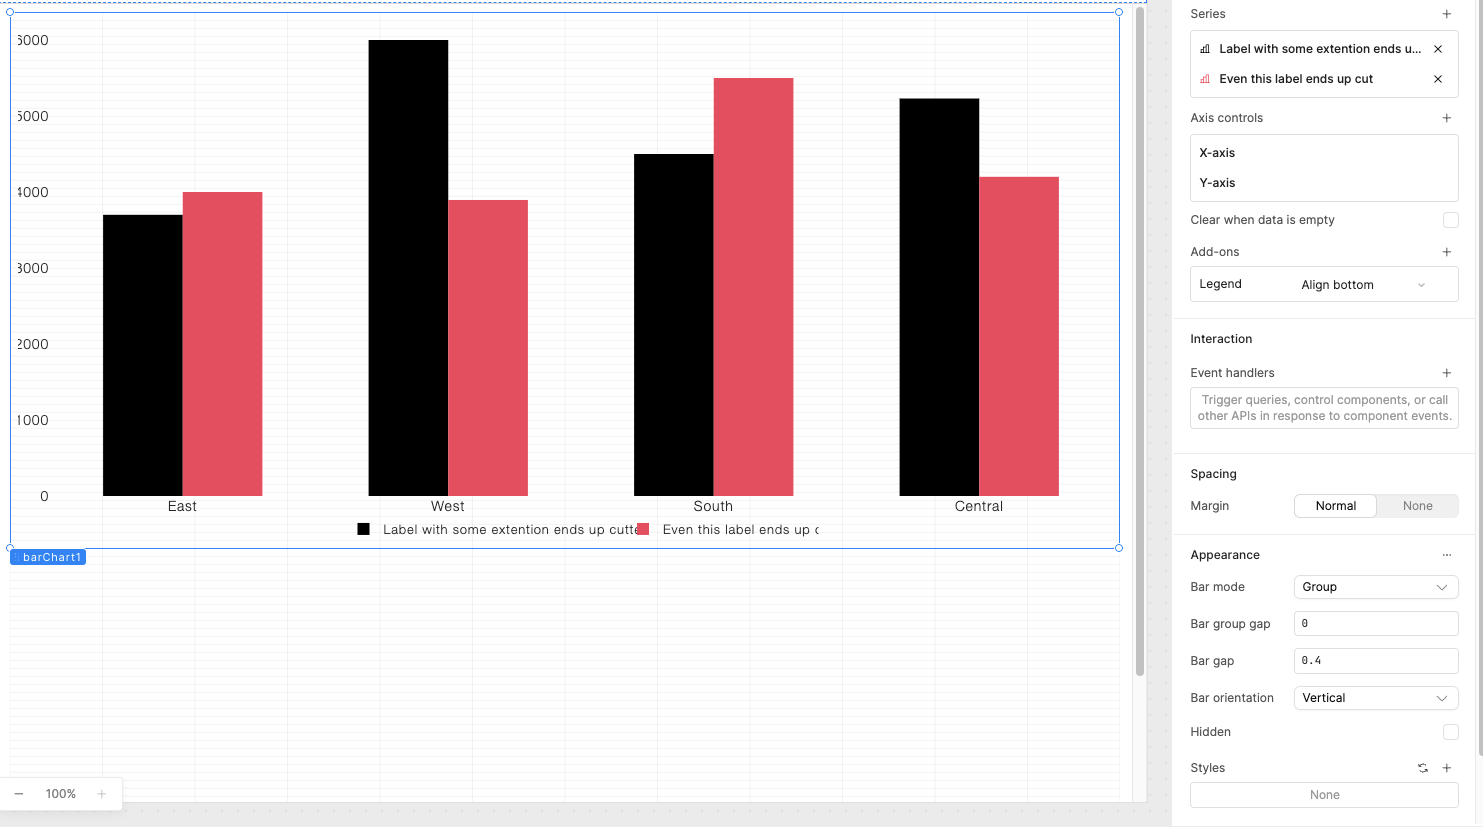
When i create a bar chart, even the default component, the values from the Y axis as well as the legends up to a certain length are being cut off.
I have tried creating the component inside a container, even on a blank new page.
As you can see in the image below, in case someone answers with just make the labels shorter or format the numbers so it fits, in my real life situation its going to be my last option.
Thank you and kind regards!
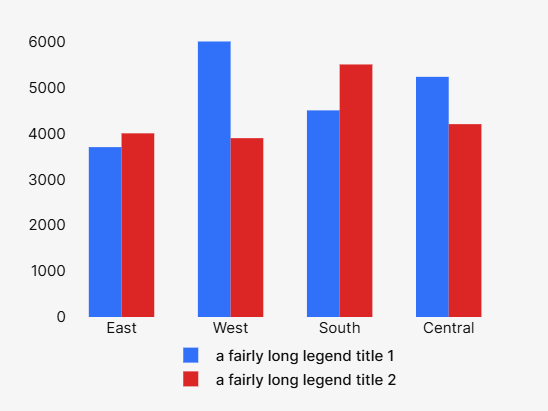
Hi @AdrianGM - do you have the graph within another component that may be affecting its behavior? When I slap a graph straight onto the canvas, it simply moves the long legend onto 2 rows (as one would expect)
1 Like
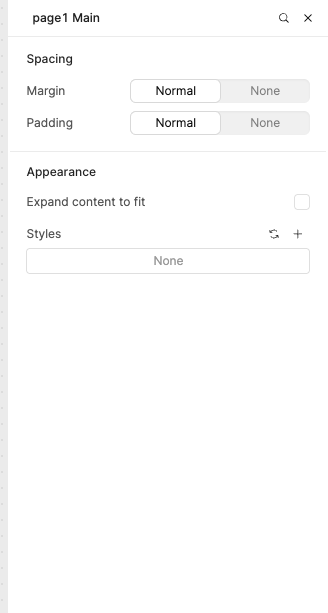
Its inside a blank new page, this are the default settings, i played around with the margin and padding, and the behavior persists
Nvm, it was a CSS that was create to affect the whole app that touches character spacing.
Thank you for the attention!