Hi,
Revisiting a very common use case for me, which is to have an editable table with months across the top, and then data rows, which is editable. Have done loads of versions that dynamically generate the columns but then it becomes difficult to (a) order the columns and (b) make them editable. So what is needed is for the table to be established for the very first time in the order that you require.
I realised, of course that 'months' are static and therefore predictable.
Note that this is a 'crosstab' report not a pivot table - it will not perform any aggregation on values.
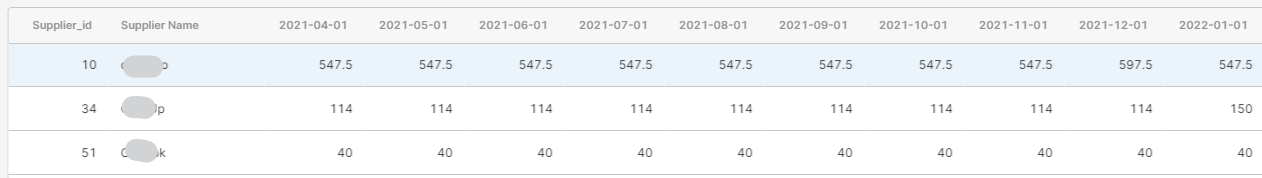
This is the output we're targeting:
Limitations
- Only works where there is a single value for each intersect - will fail ungracefully if not
- Requires a unique identifier for rows
- Needs to be sorted on the unique identifier
- As coded, this requires a numerical identifier, but that could be changed
Approach
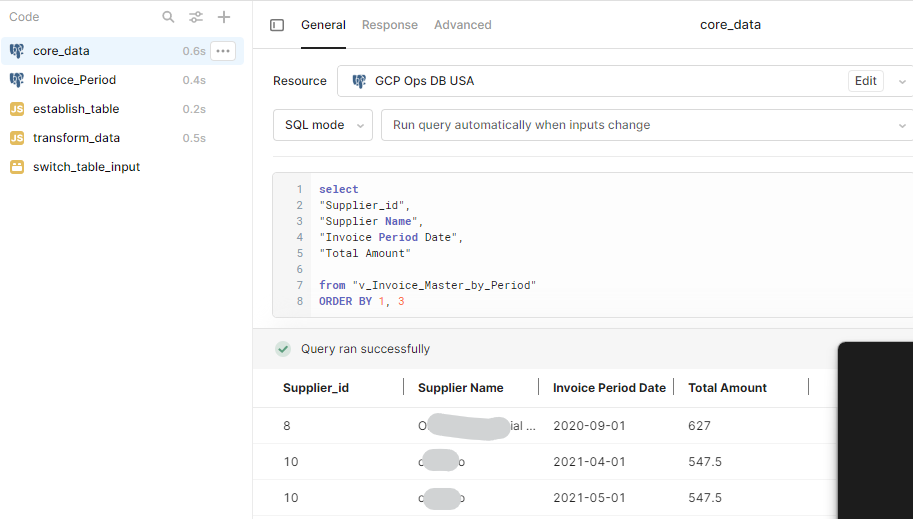
- Write a query that selects:
- the 'header' columns you want; in this case I've used supplier_id and supplier name
- a date value, and a value to include under that date.
- Make sure it is sorted by the unique id
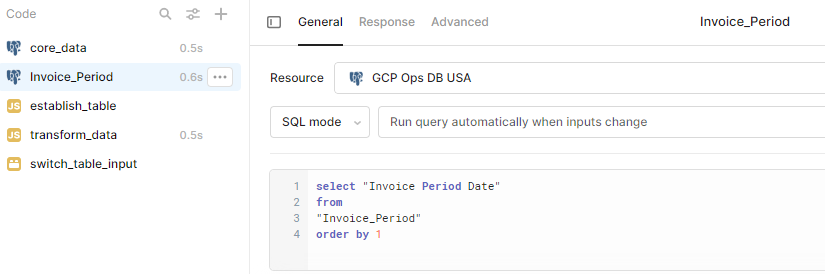
Then you need to generate a big-enough date range to accommodate all possible dates in your data. I do this so often that I have a separate database table with a date range in it:
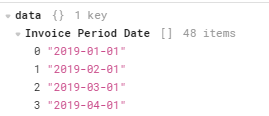
This returns this object:
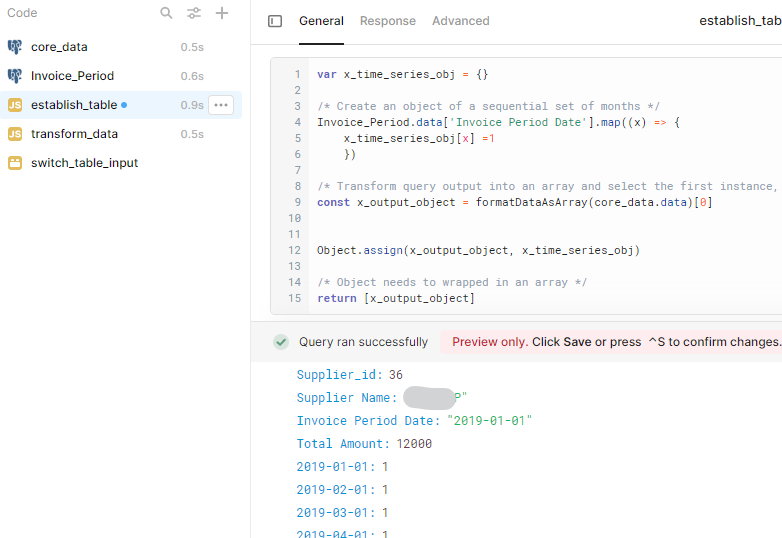
Next, we create an object which is the header attributes, plus all of the time series. Note that this actually includes the date and amount fields; it would be cleaner to count the number of object entries and then only include the total minus 2. But this works.
We use the values from the first row in the query, and then put a value of '1' in for all the dates:
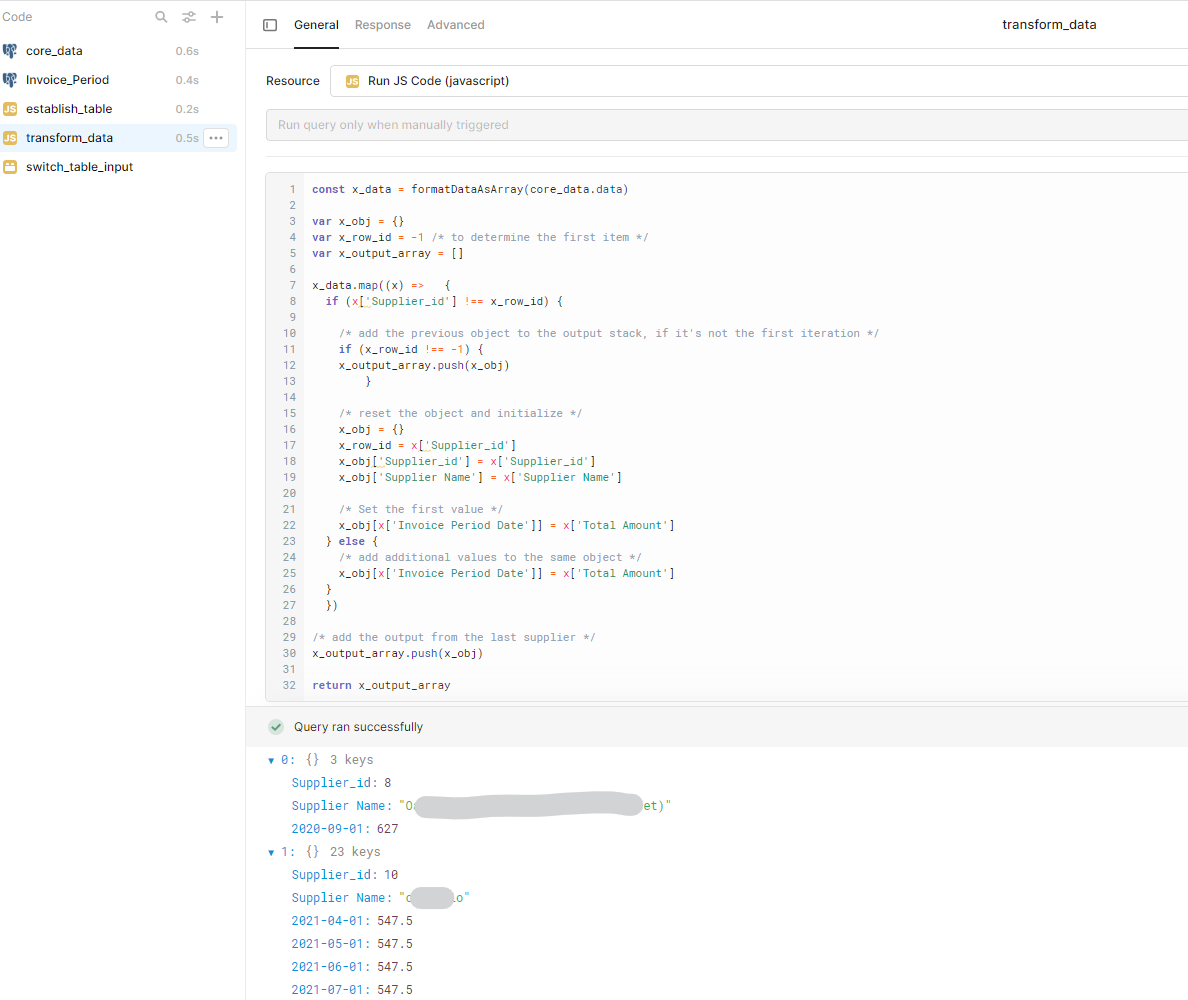
Next we create a query which iterates through the data and assigns the value amount to the relevant date object entry. This outputs one row for each unique value in the selected id column. You can see that the date value is now being used as the object key. I've hardcoded my fields here but this could be made dynamic by iterating through the entries in the mapped object (x)
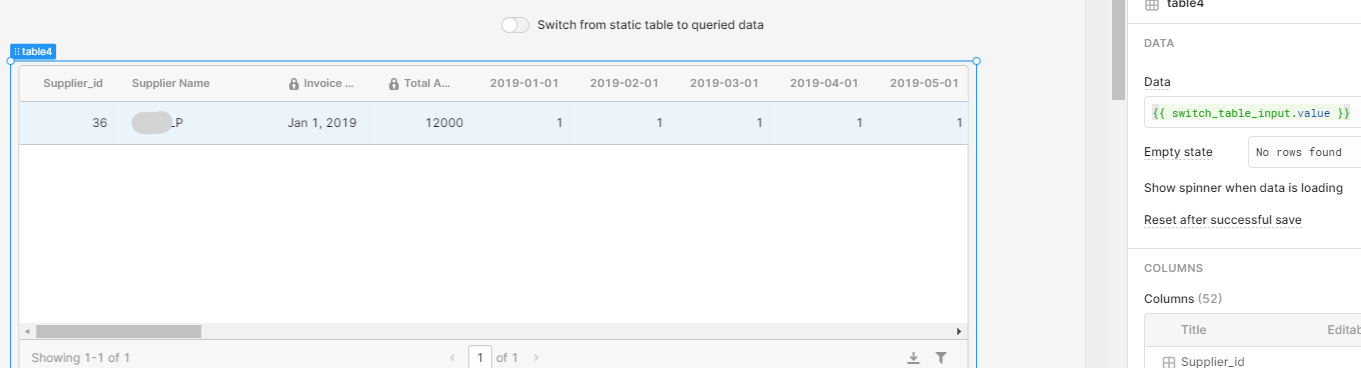
In my experience, Retool will remember the column settings and sequence from the very first time you create the table. So what we do is firstly create the table using the 'reference' query (establish_table), and then change the data input to the transformed data (transform_data). In this prototype I've made it dynamic, but I think you could just manually change the data source over once the table is created:
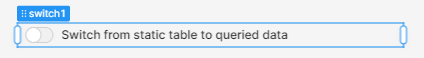
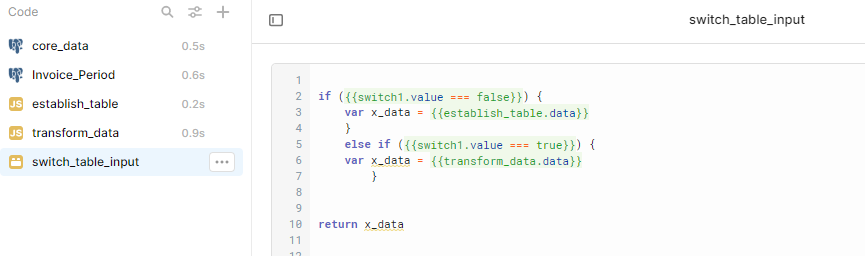
With the switch off, it's taking the reference data set:
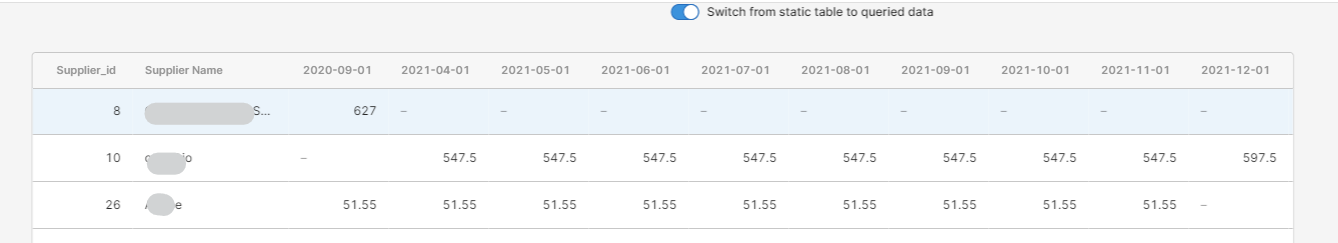
With the switch on, it's taking the transformed data set:
Proof of the concept: I have manually set one of the columns to editable. If I exit the app, and then go back in to edit - I have to manually run 'transform_data' and set the switch to true - but then this is the table I get:
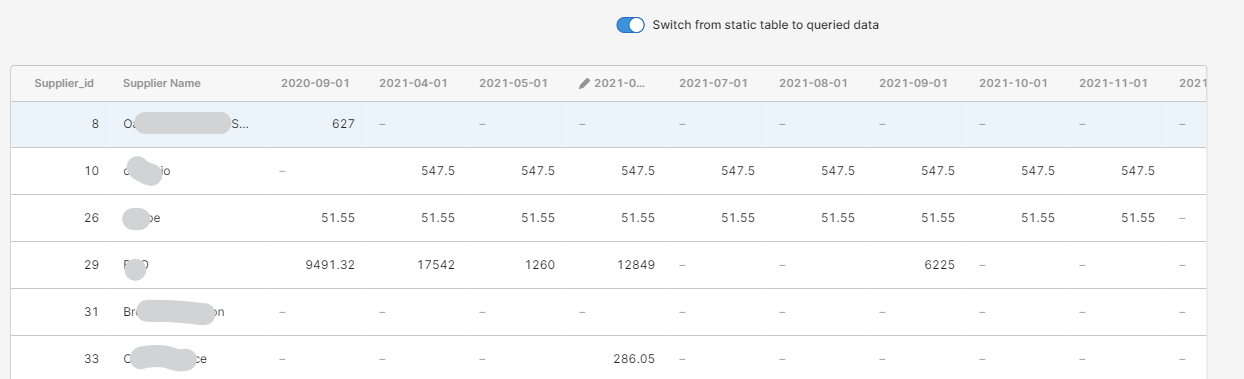
Which has preserved the data ordering, and the editable status of the column
Further notes:
This will only show columns for which there is a value, however the columns (and their settings) will still be retained in the table definition. You might choose to generate a complete header or footer row with a zero for all of the date values. Alternatively you could generate zeroes for every unused column for every row.
Anyway hope that is helpful to someone, I will likely productionize this soon and update this post.
Dominic