-
Goal: I want to render the page that will display structure of the organization. It shall be a representation of directed acyclic graph. Each node shall have name and potentially some picture in some cases.
-
steps: I have no idea how to start. I would like to avoid custom component if possiboe.
-
Details: N/A
-
Screenshots: N/A
-
App json export: N/A
Hello @Krysss!
Interesting use case, I am not sure that there are any specific components for building out a directed acyclic graph ![]()
Definitely look through our list of components on our docs here to see if any fit your need.
How dynamic are the nodes and their data going to be? If you are getting data from a database or sharing images from a third party there are some options for using image components or tables/list views that can display data.
Not sure that we have any type of 'arrow' component that would point down the graph to the next. You may want to look into more specialized graphic display tools ![]()
Hello,
thank you for the reply. Actually this organization chart is just a base for presenting other statistics and applications I would like to implement in my organization. For example I would like to present some OKRs, and how they are mapped to each level in the organization structure.
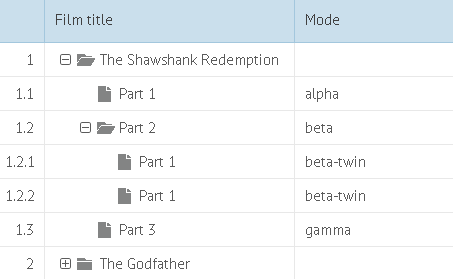
TreeTable could be enough for me actually, but it is not present in Retool (competitors have it).
Maybe you have a plan to implement it?

Ahh very interesting!
That looks like a really useful tool, I can definitely make a feature request for this ![]()
If you have any examples of orgs that have implemented it well that would be useful for learning about Tree Table functionality to implement our own!
For now the best options I can think of would be a table with collapsible rows turned on. From there you can nest other components inside of the rows to display data more thoroughly than just having it in a row.
The other option for nesting data would be a checkbox tree, as it can expand and collapse on user interaction. It can also be nested inside of a collapsible row!
=1 for this.
Instead of managing OKRs in a different package, i want to manage OKR's in Retool. Lots of cool ways to present OKRs, i like top down expanding tree thing.
Can do @Paul_Ryan ![]()
How many layers of expanding are you imaging for your use case? There may be some other components and nesting options that could work as well while we wait for this ticket.
If you have any ability to try custom components, you could almost drop in one of Workflow Editor - React Flow solution's. This is similar to retool's WorkFlow editor(they use react-flow)
Also I made a post about my reorderable tree component, Reorderable Custom Component
The same library also allows multi parent relationships etc
