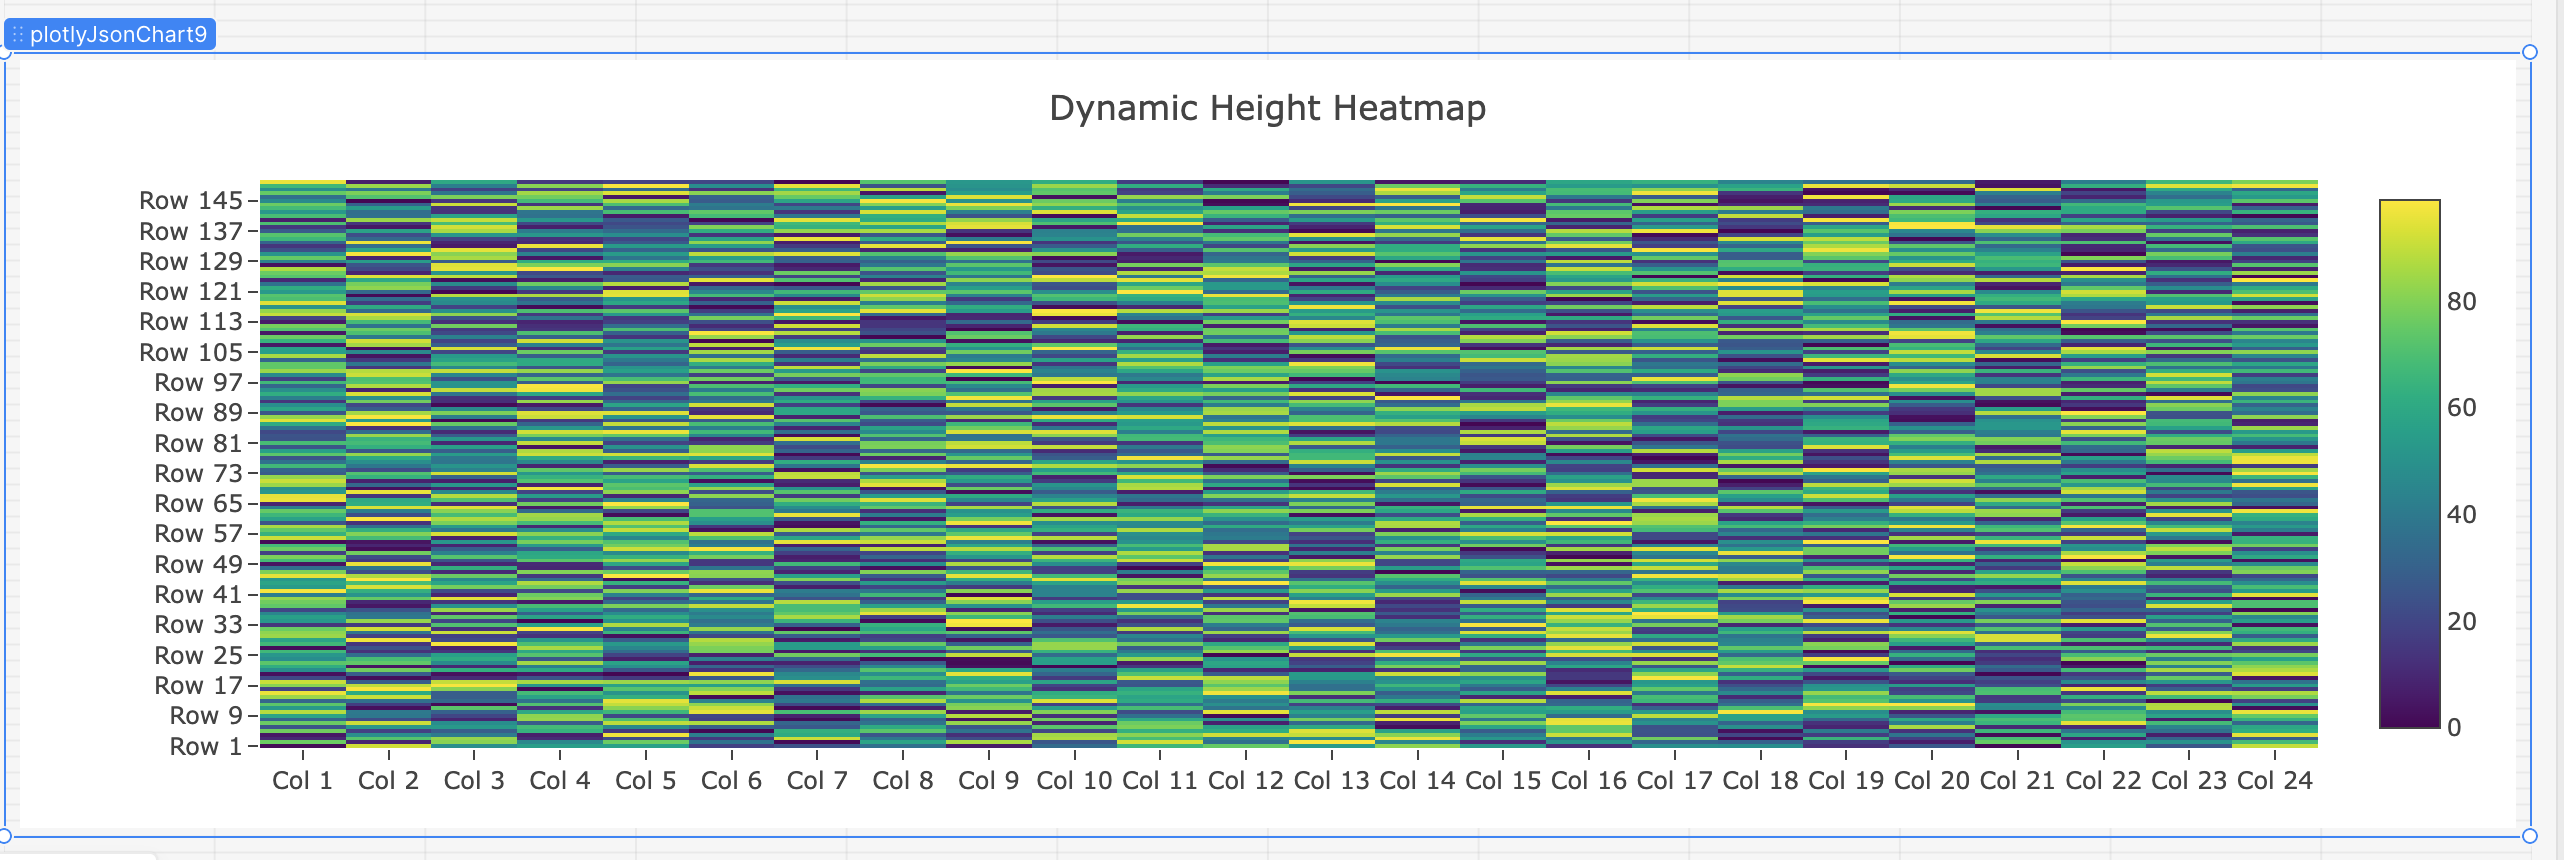
I'm building a heatmap using Retool's Plotly JSON Chart component and need the chart height to scale dynamically based on the number of rows in my data (which can range from 50 to 1000+ rows).
What I've Done:
-
My JavaScript query calculates the height:
height = (numberOfRows × 10px) + 150px -
This value is correctly set in
layout.heightin the returned JSON -
I can verify the height is calculated correctly - when I check
plotlyJsonChart.plotlyLayoutJson.height, it shows the right value (e.g., 1500px for 150 rows)
The Problem:
Despite the layout.height value being correct, the Plotly component does not resize to match it. The chart either:
-
Squishes all rows into a fixed container height (making them unreadable), or
-
Stretches rows to fill a fixed container height (making them too tall)
The component's visual size on the canvas (e.g., "12 × 460" in grid units) stays fixed regardless of the layout.height value.
What I've Tried:
-
Setting height in the JavaScript query's layout object (value is correct but ignored)
-
Using
{{ graphCreator.data.rowCount * 10 + 150 }}in the Layout JSON field (breaks the layout) -
Wrapping in a Container with various height settings (no dynamic height option found)
-
Setting
autosize: true/false(no effect) -
Using spread operator to override height (doesn't work in Retool JSON fields)
The Question:
How can I make the Plotly JSON Chart component's actual rendered size match the layout.height value I'm setting? The component seems to have its own container size that overrides the Plotly layout height.
Is there a way to programmatically control the component's canvas size, or make it respect the layout.height value from the JSON?