Maybe I'm being completely blind and I can't find a way to do this.
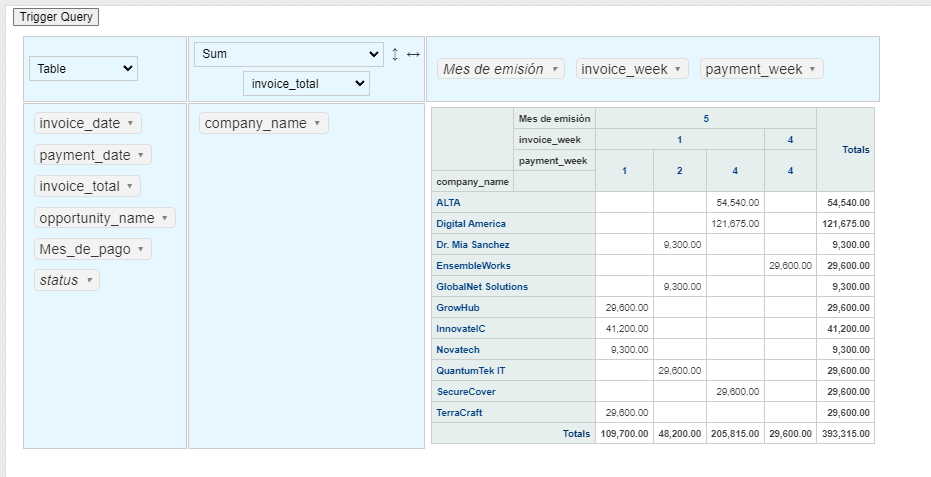
It would be great to have some sort of "Pivot Table" setting for a table. Right now, we are constrained to one type for column, which makes it difficult for some types of visualization, e.g.
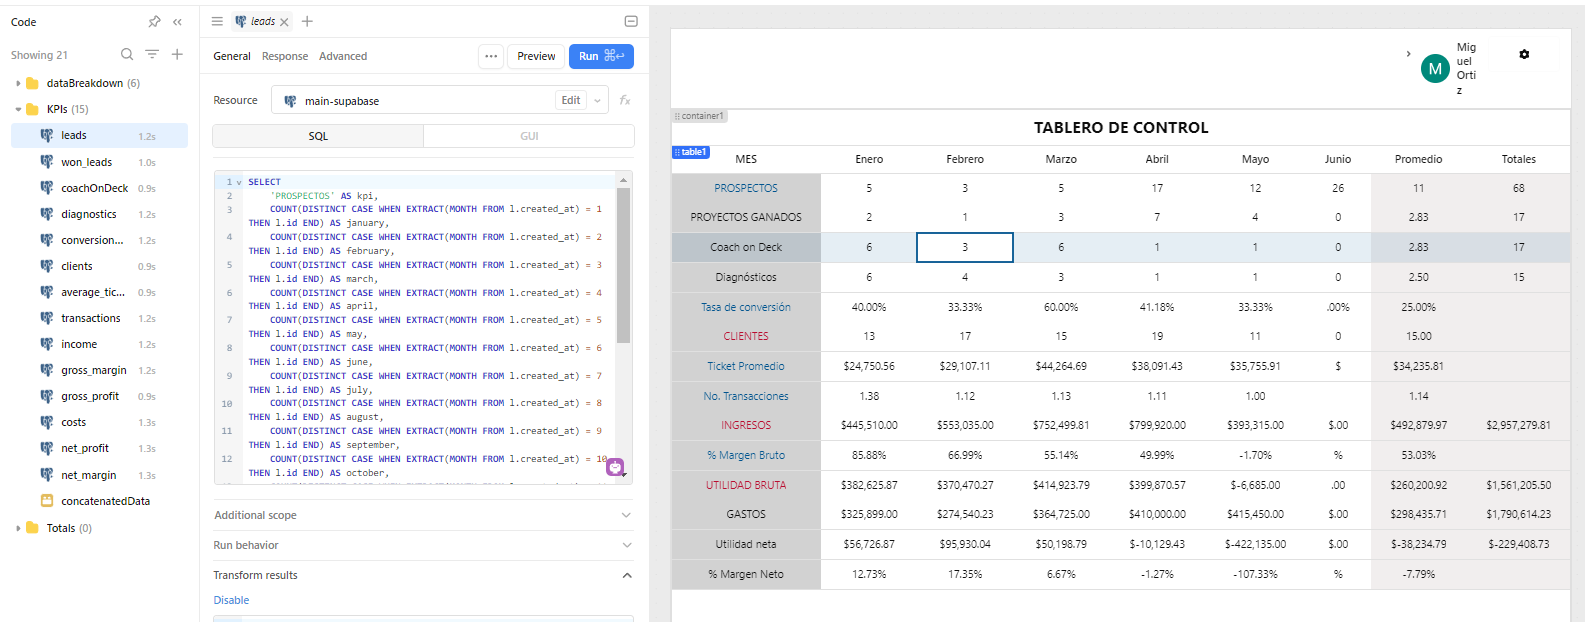
As you can see, this table is showing numbers, averages and currency types for each column. To achieve this I had to pull data for each row separately, format them as string with the symbols/decimals as needed, and then concatenate them all together.
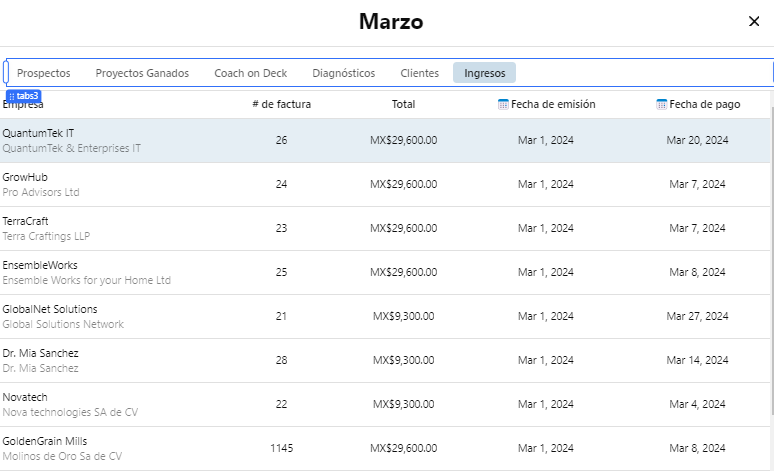
Upon clicking a cell, a modal will open and show the underlying data:
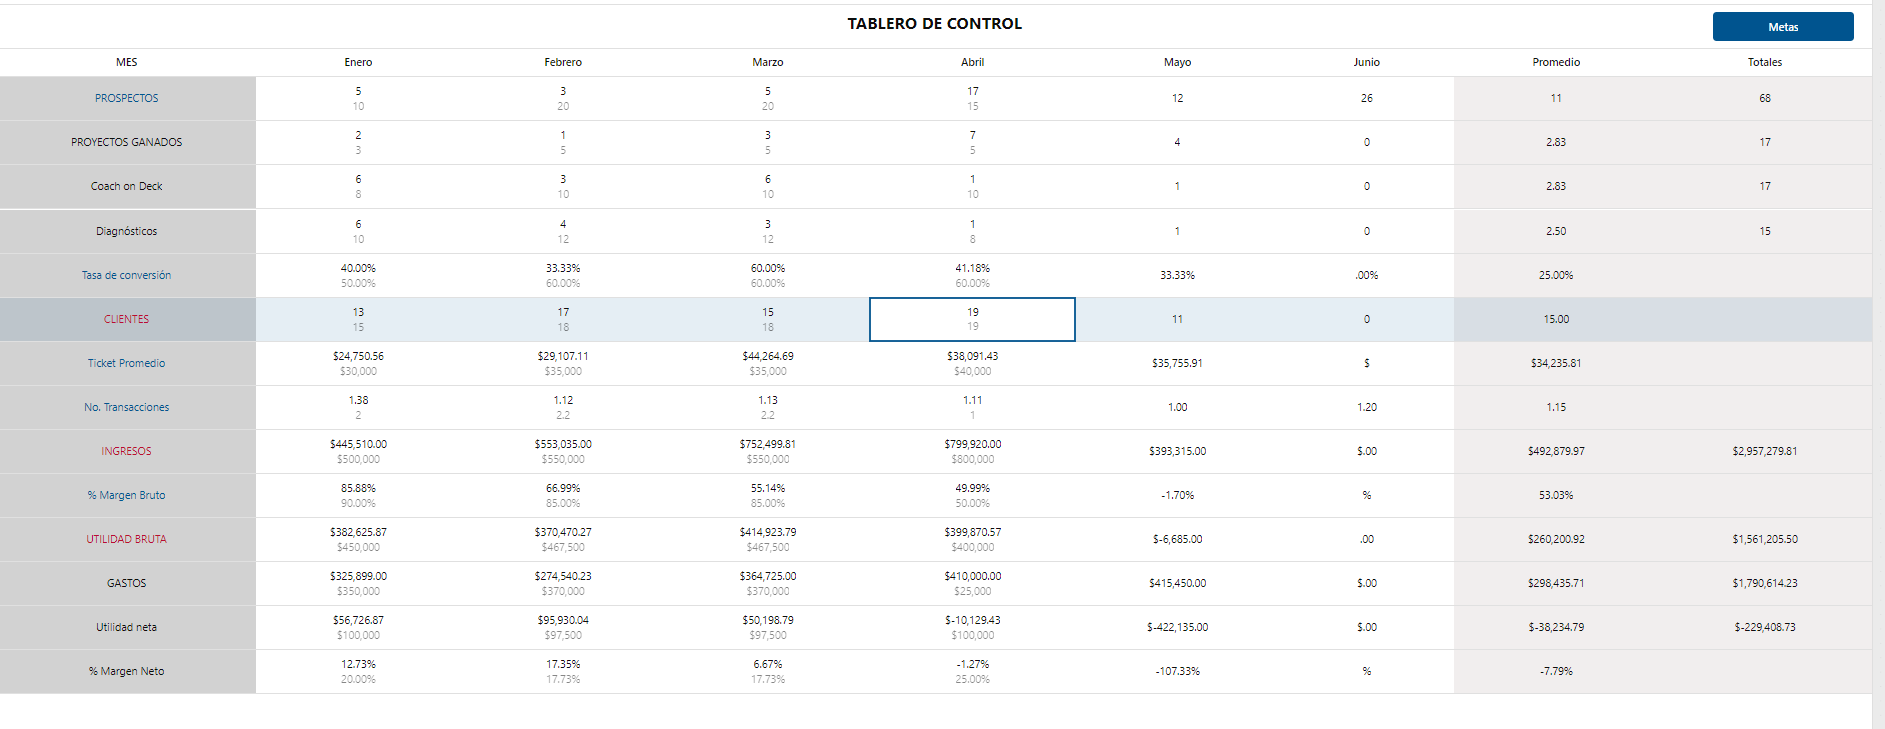
It works well, but it took me way more than I would have liked. And also, now I want to add the targets for each month and I'm scratching my head thinking the best way of doing that..... should I factor them in in each of my queries?? Should I do it separately and map them with a caption / status indicator (if I can reallly map them...)
Taking the spirit of this June's competition, I'm tagging @bobthebear, @pyrrho and @jg80 hoping their neverending resources will be of helpful insight!
Edit: and why not, @Tess and @joeBumbaca as well, let them jump into the pool
Second (and there's no need to try to implement this you just have me thinking), have you considered a horizontally oriented list view component to show the data by month? I feel like you could make a narrow width component for the view instances that have the row data for that month's entries and have those repeat across through a container (and still get the totals in).
Thanks Scott, I'm happy to say that the client also likes it
I thought of a list view and, thinking about it, I guess it would be easier to manage the data (in theory). However, I find the list view seldom achieves the look & feel of a table, especially for people who are SO used to excel, (and who have so many other tables across their apps).
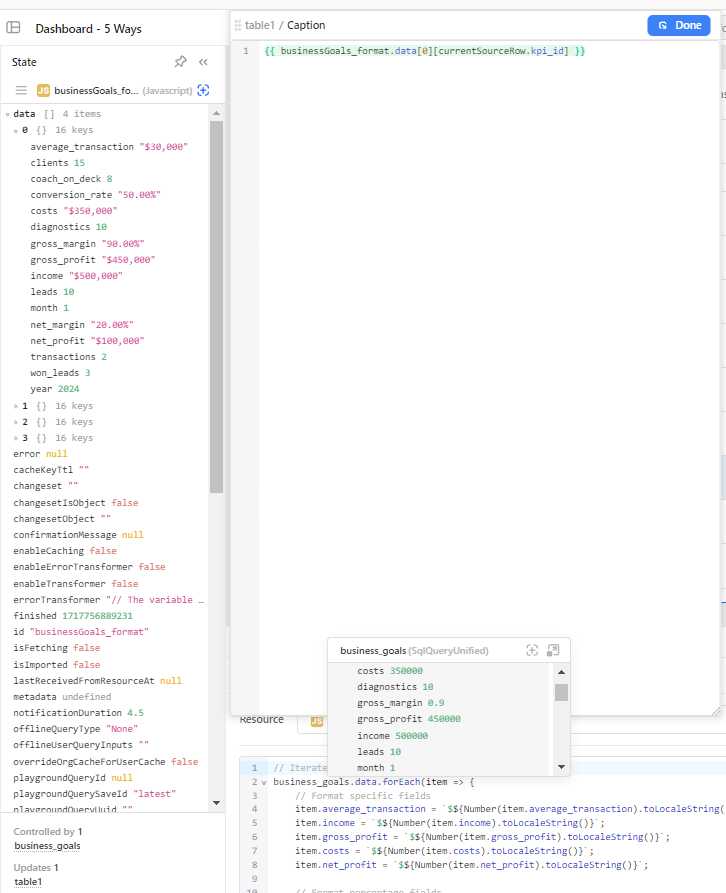
I also managed to format them quite quickly with a javascript, which now that I think about it I think I could have done as well for my table info, instead of having SQL formatting everything...
if you made another query or something and named it like sqlToString(input1) you wouldn't have to add specific conversion code to each column value.
var return_value = "";
switch(typeof input1){
  case 'string':
    return_value = input1
    break;
  default:
    //handle unknown types
    break;
}
return return_value;
I'm not sure if typeof would work and you might actually want to add this as a postgresql function and make a view out of it. if you need to speed up the time it takes displaying (reading, converting then displaying) you could try adding a trigger to the db on insert and auto converting fields to text so when you query it you don't need conversions at all.
This is all great stuff - dynamic pivot tables are a big missing component that I've been (mainly) avoiding in designs so far. I've been fiddling around on and off with PostgreSQL functions to try to generate dynamic pivots that I would send along to the UI once I get them working...will share here too if I ever do!
I've been using this regularly, it works very well, I have since made a generic pivot table module which I'll see if I can find the time to make a post for.
did you ever solve that Orb.js problem you mentioned in that post? I'm guessing you did since you've been using it regularly, but ya was curious what the right way to do that was. mostly kinda curious if you ended up having to use pgridwidget().render or ReactDOM.render(). was also wondering if you had gotten a chance to see if hydrateRoot(document.getElementById('react'), \<ConnectedComponent />) or something would fix that refresh/reload problem by attaching to the current root instead of creating a new one
Hey. No I didn't, I've just carried on using pivot.js. It's basic but it's very quick doesn't take up a lot of real estate, and it works. Use it all day every day
Hey @MiguelOrtiz, I agree! We get this request pretty frequently. I linked this conversation to an existing ticket. Unfortunately, I don't think we're prioritizing this at the moment, but I will let you all know if the status changes in the future.
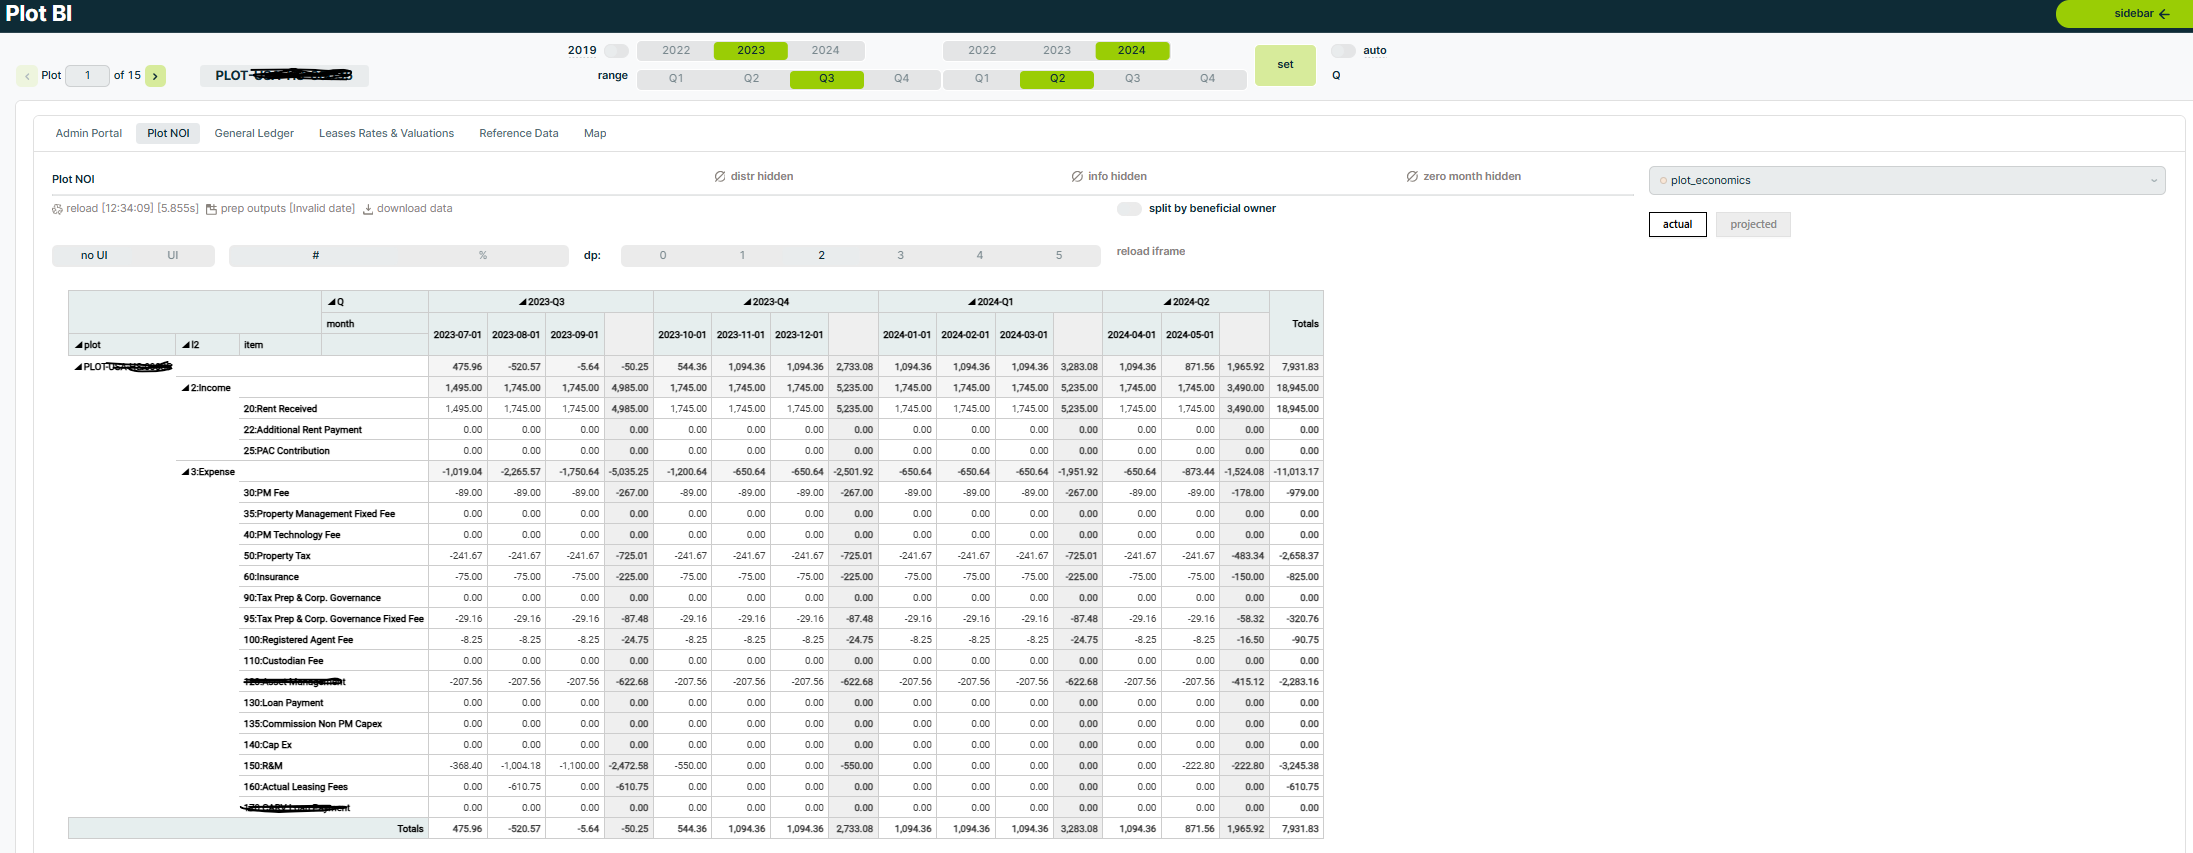
Hi. Yep exactly that, this is how I use it. I have a very large number of highly context sensitive filters; mainly I'm looking at financial data so the filters vary across the app estate. Usually I'm interested in looking at quarters so I have a date selector component which makes it easy to set a quarter-to-quarter date range. I also have a '% / numbers' toggle as some of my data is percentages, and a 'decimal places' toggle. All of these get fed into a transformer which filters the query results that get fed to the pivot table. Lastly, I have a switch to switch the UI on or off if you do want to do anything different. I will try and find time to post all this up but just too slammed right now