Hi folks,
We have a challenge where I though someone may have done something similar already and might be willing to share some code so we don't have to build it all from scratch. I believe this problem can be solved with a javascript query that builds a two-diemensional array which is then used to populate a Table, but I believe the javascript to build it is going to be quite complicated.
We have a test api that returns nest data like this:
>     "data": [
>         {
>             "intervalType": "MILEAGE_MILE",
>             "severeDriving": true,
>             "operations": [
>                 {
>                     "interval": 5000,
>                     "descriptionList": {
>                         "551422": "Engine Oil Filter R&R",
>                         "551473": "Engine Air Filter Element Inspect",
>                         "551474": "Engine Oil Drain & Refill"
>                     }
>                 },
>                 {
>                     "interval": 10000,
>                     "descriptionList": {
>                         "551627": "Drum Brakes Inspect",
>                         "551749": "Steering System Inspect",
>                         "551493": "Suspension Ball Joint Inspect",
>                         "551896": "Body Fasteners Torque",
>                         "551674": "Suspension System Inspect",
>                         "551580": "Body Latches, Locks & Hinges Inspect",
>                         "551517": "Brake Linings Inspect",
>                         "551805": "Weatherstrip Seal Inspect",
>                         "551741": "Steering Linkage Inspect",
>                         "551422": "Engine Oil Filter R&R",
>                         "551518": "Brake Rotor Inspect",
>                         "551473": "Engine Air Filter Element Inspect",
>                         "551474": "Engine Oil Drain & Refill",
>                         "551412": "Brake System Inspect",
>                         "551895": "Frame Fasteners Torque"
>                     }
>                 },
>                 ....
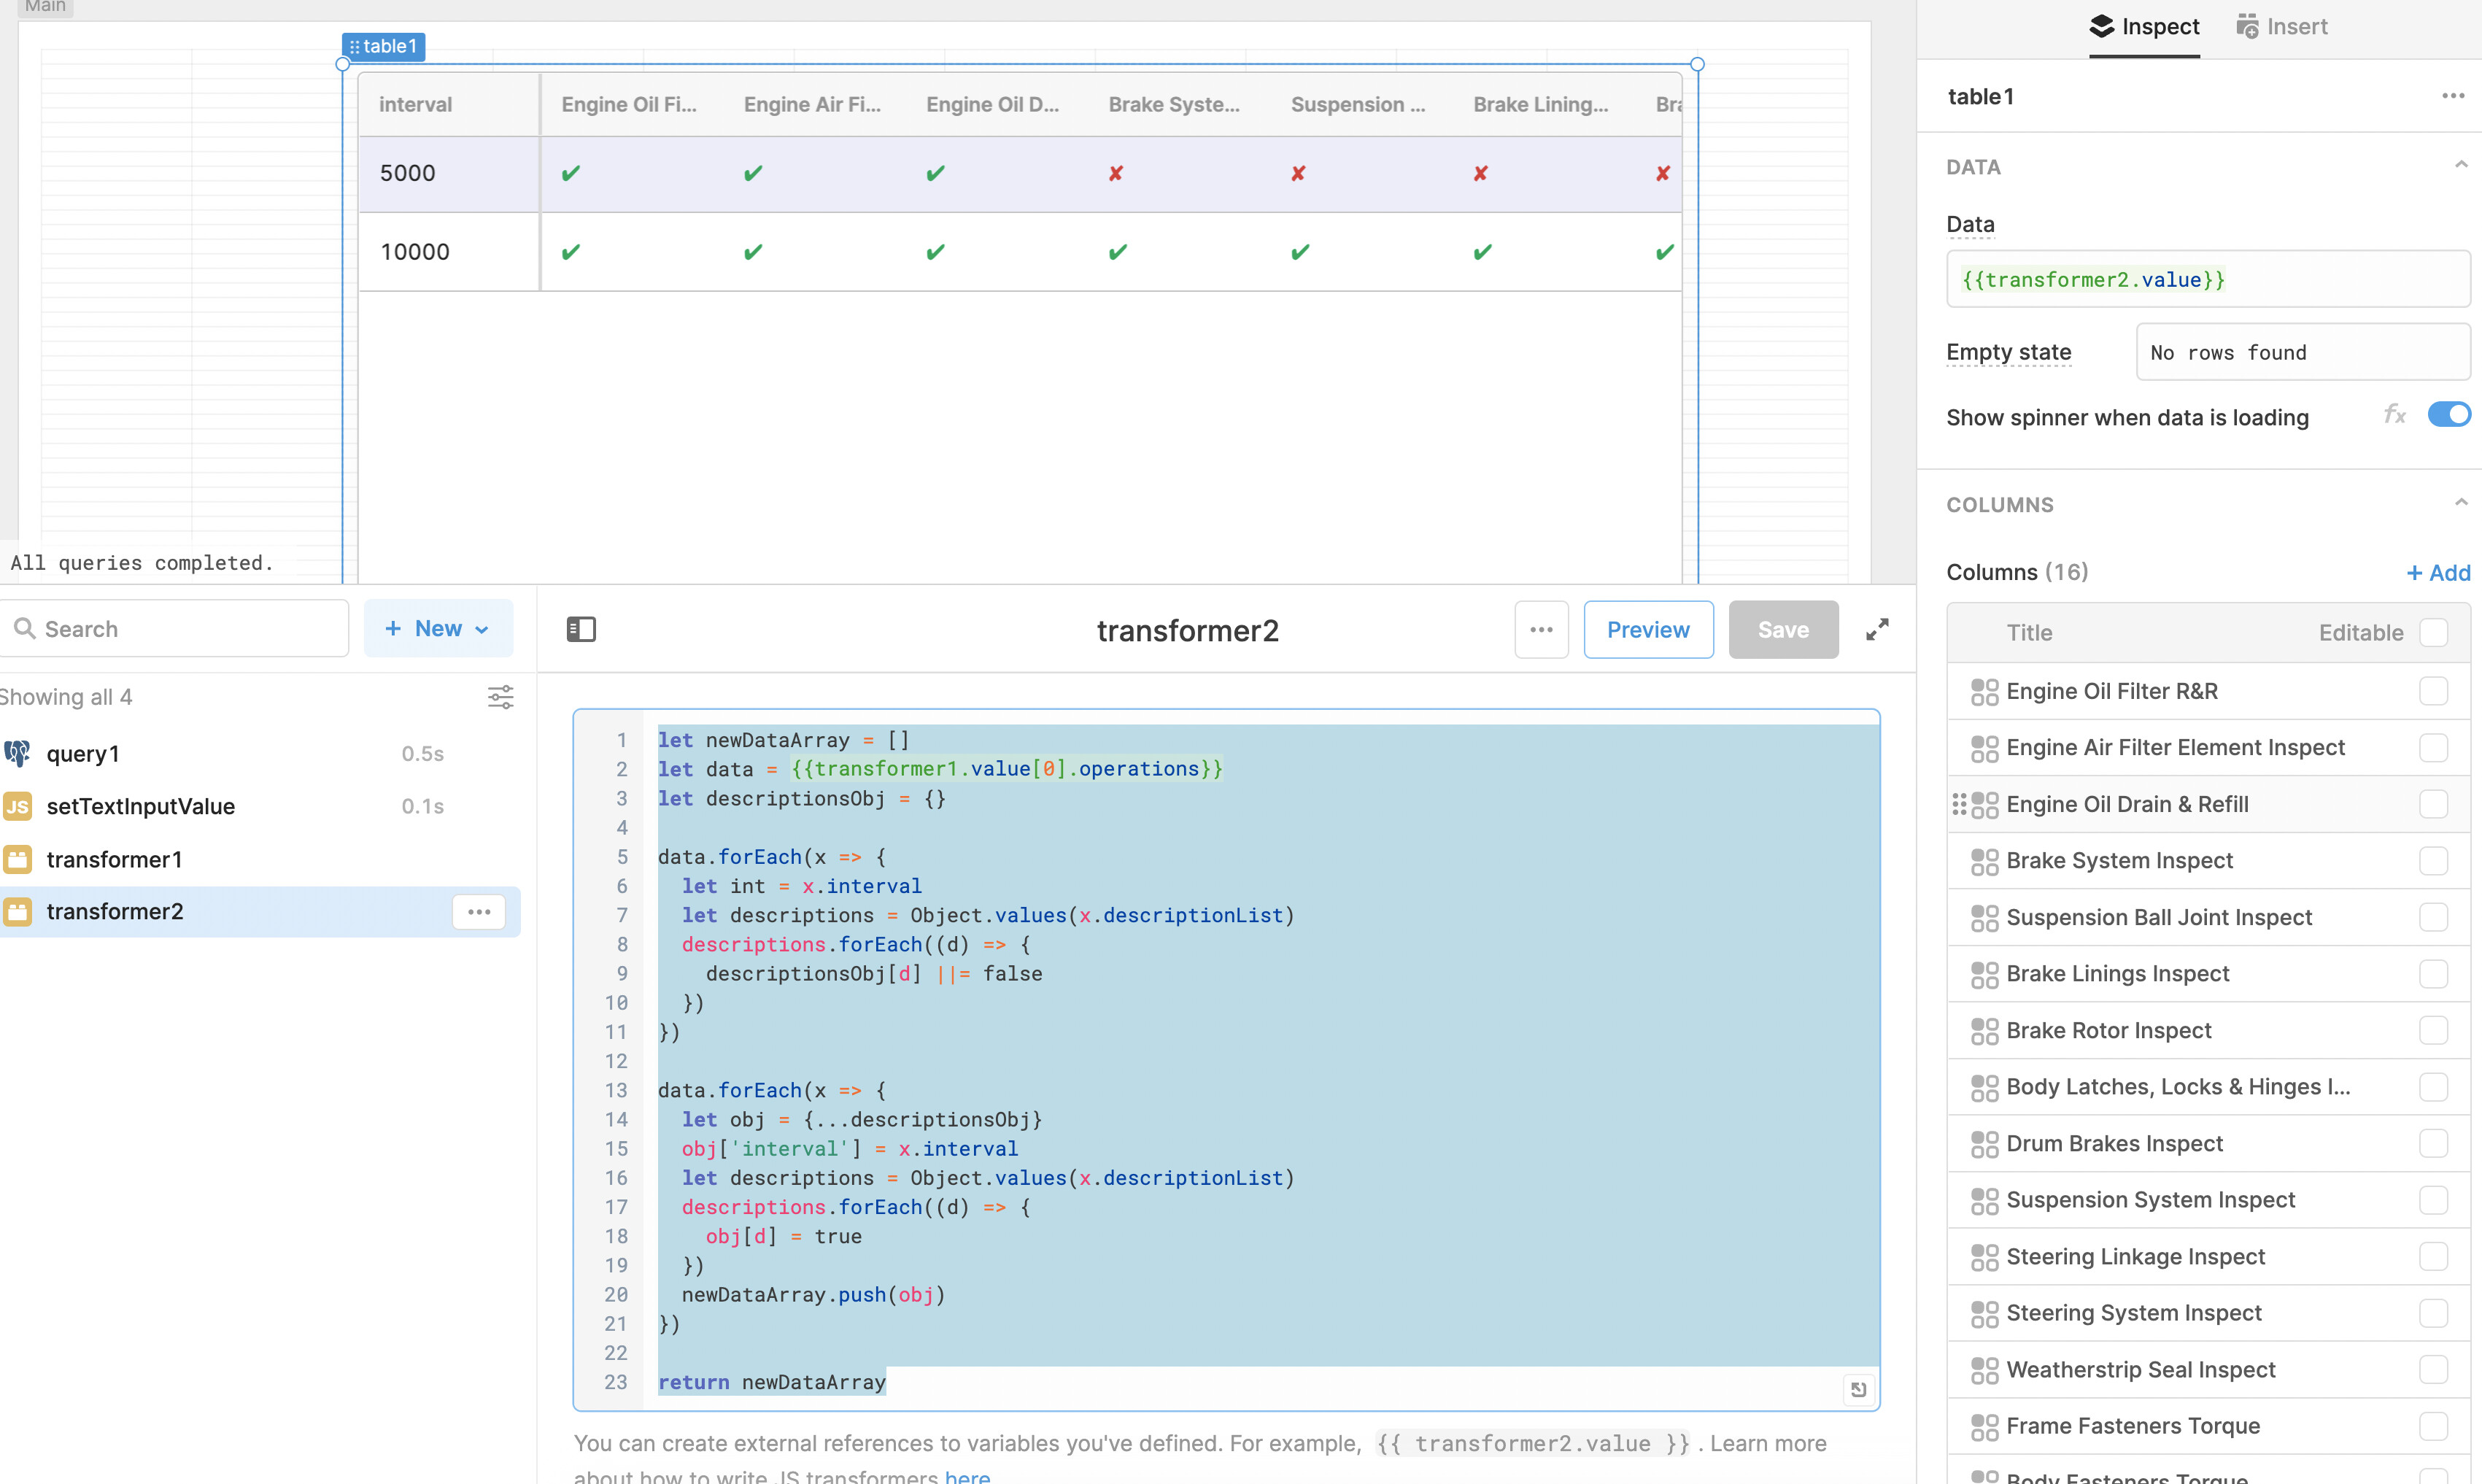
where the "interval" values need to become the horizontal axis and the "descriptionList" values need to become the vertical axis, with cells populated with an "X" or something in the intersection. The results would look similar to this:
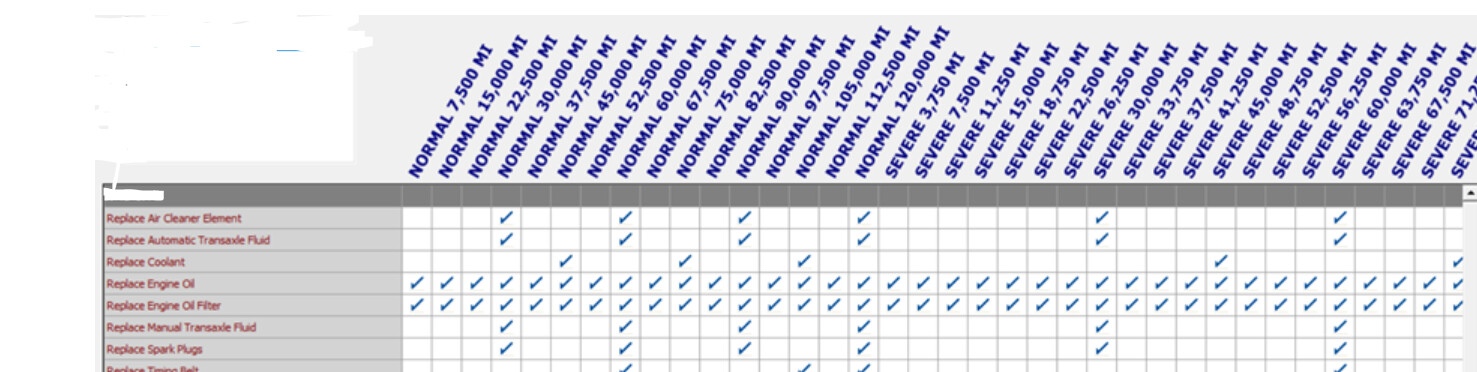
Anyone done anything similar?