I am pulling two exact queries to calculate revenue on two separate websites. The query is rather simple:
select sum(action_value) as revenue from member_actions where action_value != '0' and created_at between {{moment(dateRange1.startValue)}} and {{moment(dateRange1.endValue).endOf('day')}}
Just weeks ago I was able to run both these queries in similar times 4.0 - 9.0 seconds, but now one of the queries had failed to load revenue for days.
I tried using a different component such as the 'date' component rather than the 'daterange' to see if that was the issue with no changes. As a quick fix, I even tried to create a bunch of smaller queries of 4, 6, and 12 hour increments and summed them in a transformer hoping the smaller queries would run before timing out. Then a new issue has started where the query does not even timeout at 120 seconds now and keeps going even though it was set to timeout at 120.
Other users on these dashboards noticed another bug where the date range was displaying ghost data and grabbing data from days not specified by the date range. I later came across this issue myself and found it already explained in another post; Table data gets confused when date range updated - #7 by everett_smith
Any advice on how I could possibly attempt to get this query to run more efficiently would be welcome. Since there has been multiple issues with the dateRange component, I am using this has a way to narrow down if the cause is from Retool or my own internal system.
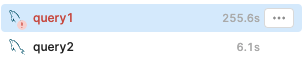
Ambiguous "Running queries..." has been affecting our apps for the last month or so. The queries are always for our internal API.
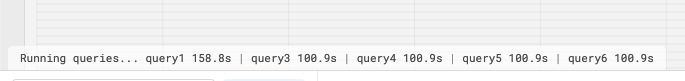
Sometimes the little log will say which query with the timer (as the original post above shows), which is concerning because on those occasions the counter(s) goes well over the configured timeout(s) in the query's Retool settings.
Usually refreshing the entire pages fixes the issue, but given our circumstances this can get annoying real fast.
Sorry for the lack of detail, but I'm hoping to hear if others are encountering the same general issue.
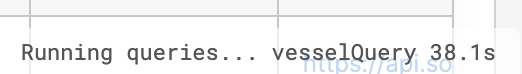
Ah, actually had the exact problem occur right after posting above.
vesselQuery is running 38s and counting, yet its timeout is at 15s... how is this even possible? This would seem to be a Retool issue, as I cannot think of a way I should be able to cause this by, say, user error.
Hey all — sorry for the slow reply here, the cause of this can vary but this typically comes up in the frontend due to specific configurations. For anyone running into this issue please write into support chat so we can dig into your apps one-on-one to make sure we can properly look into this for you!
Sounds good, Chris; thank you! I'm used to using the support chat but have been branching out to the forums occasionally, so this direction is helpful.
I'll reach out directly about my specific long-running query issues soon.
For anyone who hasn't used the support chat method: give it a try. My experience reporting and verifying issues there has been great overall.