Is there a diagram or flowchart of queries and components?

Is there a way to export or otherwise see all the connections between queries/ components and other queries/components?

I can follow it through the "view state" window in the main screen and in the debug area, but it'd sure be nice if I had a map or diagram showing which queries updated other queries/transformers/components so I could track things down.

Here's the use case: we had a database table that we used for populating which states (USA states) were available and in what groupings. We are discontinuing that table and using another table. However, the new table will not have the same structure and columns, so not only do I have to change the main table, but I have to restructure all the other pieces.

I COULD just use the new table and force it to output in the same way as the old table, but this is still challenging. Plus, I'd like to take this opportunity to make some improvements. After all, Retool has improved since we created this app, and my skills have also improved - so it's a perfect time to make things nicer in the code.

But to do this, I need to have that diagram showing which query/component is affecting other queries/components.

Does Retool have a native tool for this? Has anyone else had this problem and created a tool to do this? (I'm envisioning a tool that uses the JSON export of the app and magically produces this diagram.)

I'm keeping my fingers crossed!

1 Like

I was recently looking for the same thing and it appears to be something that should be released soon. I did find this however to make things a bit easier until we get that neat tool that they teased :pleading_face:
image

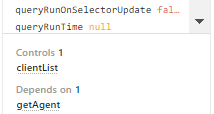
Its ALLLLLLLLLLL the way down at the bottom of the State window

1 Like