Hi @pench! I see you've asked about something like this before in a previous thread. I would suggest trying to follow that original user's steps if you want to display charts/visuals in the chat component itself, but in general it's not something built in to Retool.
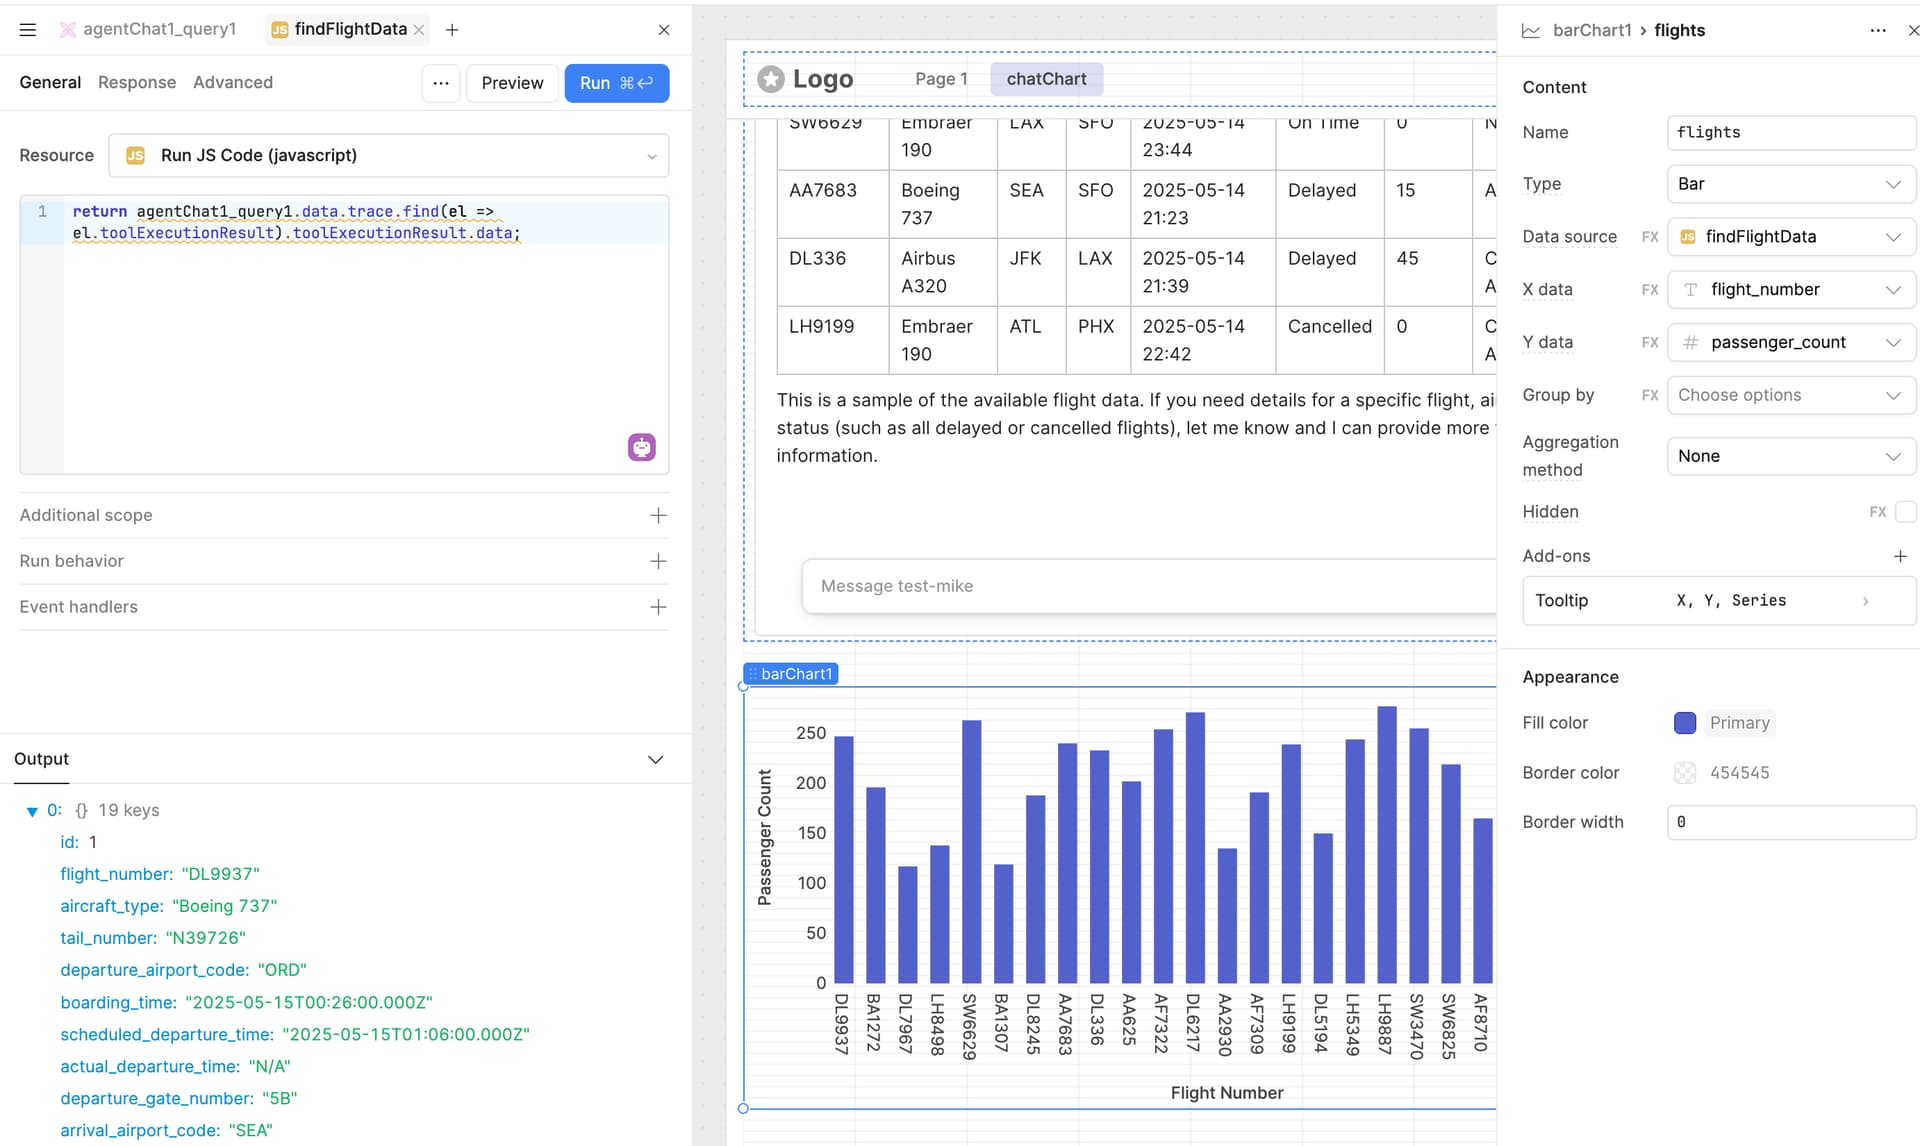
However, if you're ok with having a separate chart component, I think this could be a use case for a Retool Agent, which is a new feature as of last week! You can create an agent that can perform your custom query, and then create an Agent Chat component which uses that agent. The data returned by an Agent is a lot easier to reference compared to an LLM chat component. I'll show a screenshot below of a quick implementation I tried but it can definitely be improved upon for your use case.