Hey (2 months ago) Bradly! Are you still seeing this behavior?
There's a secret (not polished, not released, not fully-developed or supported) developer panel that might be helpful in cases like these!
ctrl + ` (backtick) will bring it up.
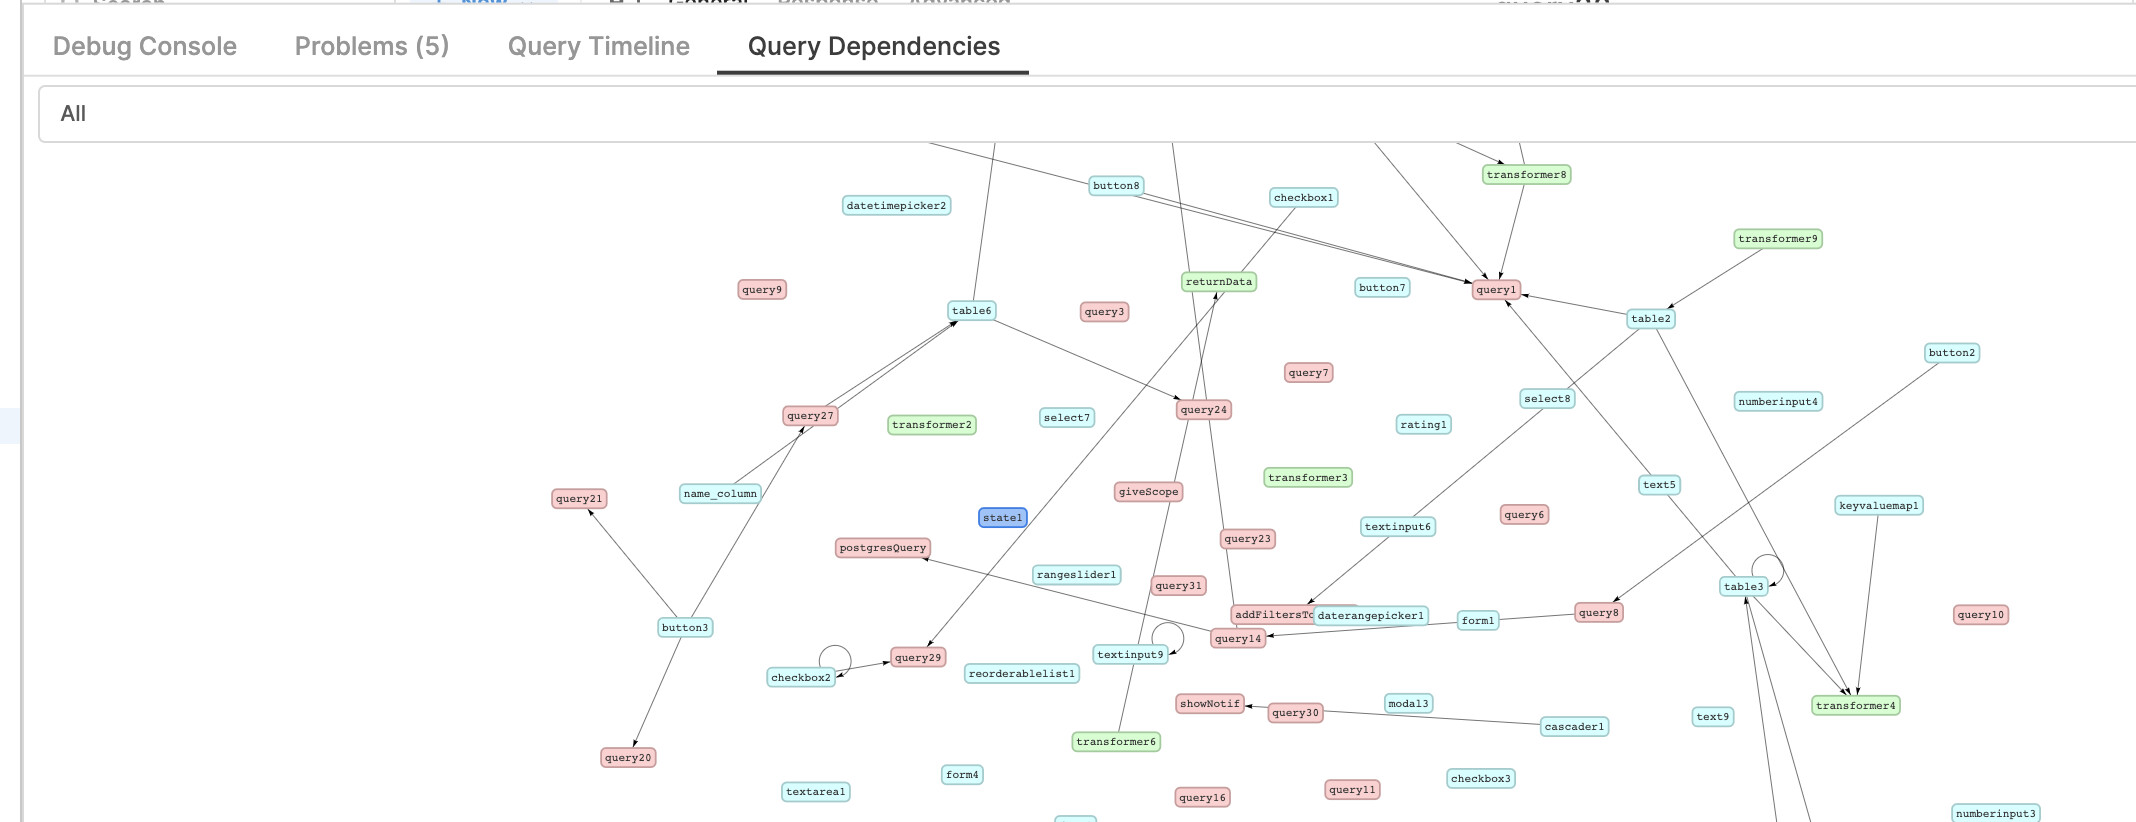
It has a query dependency tab that gives you a graph of your components and queries. You can even select a specific query to see who it's running and who's running it!
In general, the more heavy and complicated the app, the longer it'll take for this panel to come up so you may need to press the hotkey again and wait up to a minute or so. For reference, my not overly complex app (see screenshot) took about 5-10 seconds to pull up the panel!