One of my apps has a nest of tables and subtables and subtables and subtables. Each table has a query that of course relies on a parent table's ID to populate. Well, when I update the master parent table, it starts a cascade of re-querying down the line. Totally fine. Not fine is many of the queries get run more than one, the bottom most ends up getting run 4 times!
My puny brain is failing to trace all of this and figure out what is calling what other than the obvious path I think it should be taking. I spent quite a bit of time in the debug console (ctl-`) and I can certainly see all of the queries and how long they took and such, but there is no way to determine what fired this query or that query that I can determine.
Is there a way to determine some sort of stack trace or should this be moved to Feature Requests?
Hey (2 months ago) Bradly! Are you still seeing this behavior?
There's a secret (not polished, not released, not fully-developed or supported) developer panel that might be helpful in cases like these!
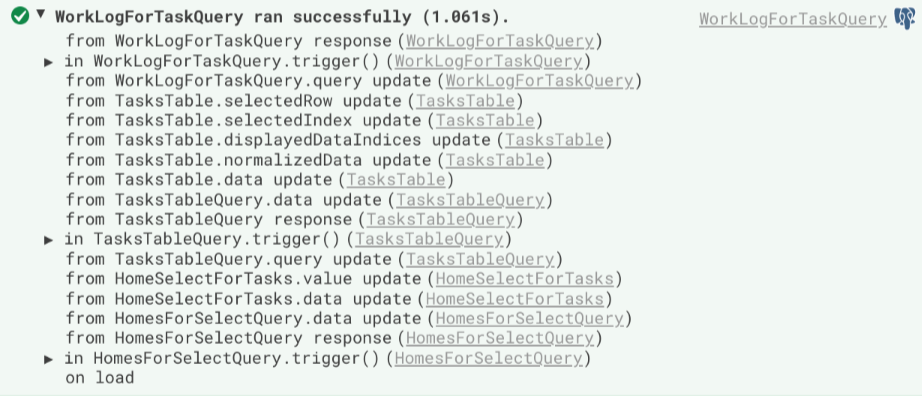
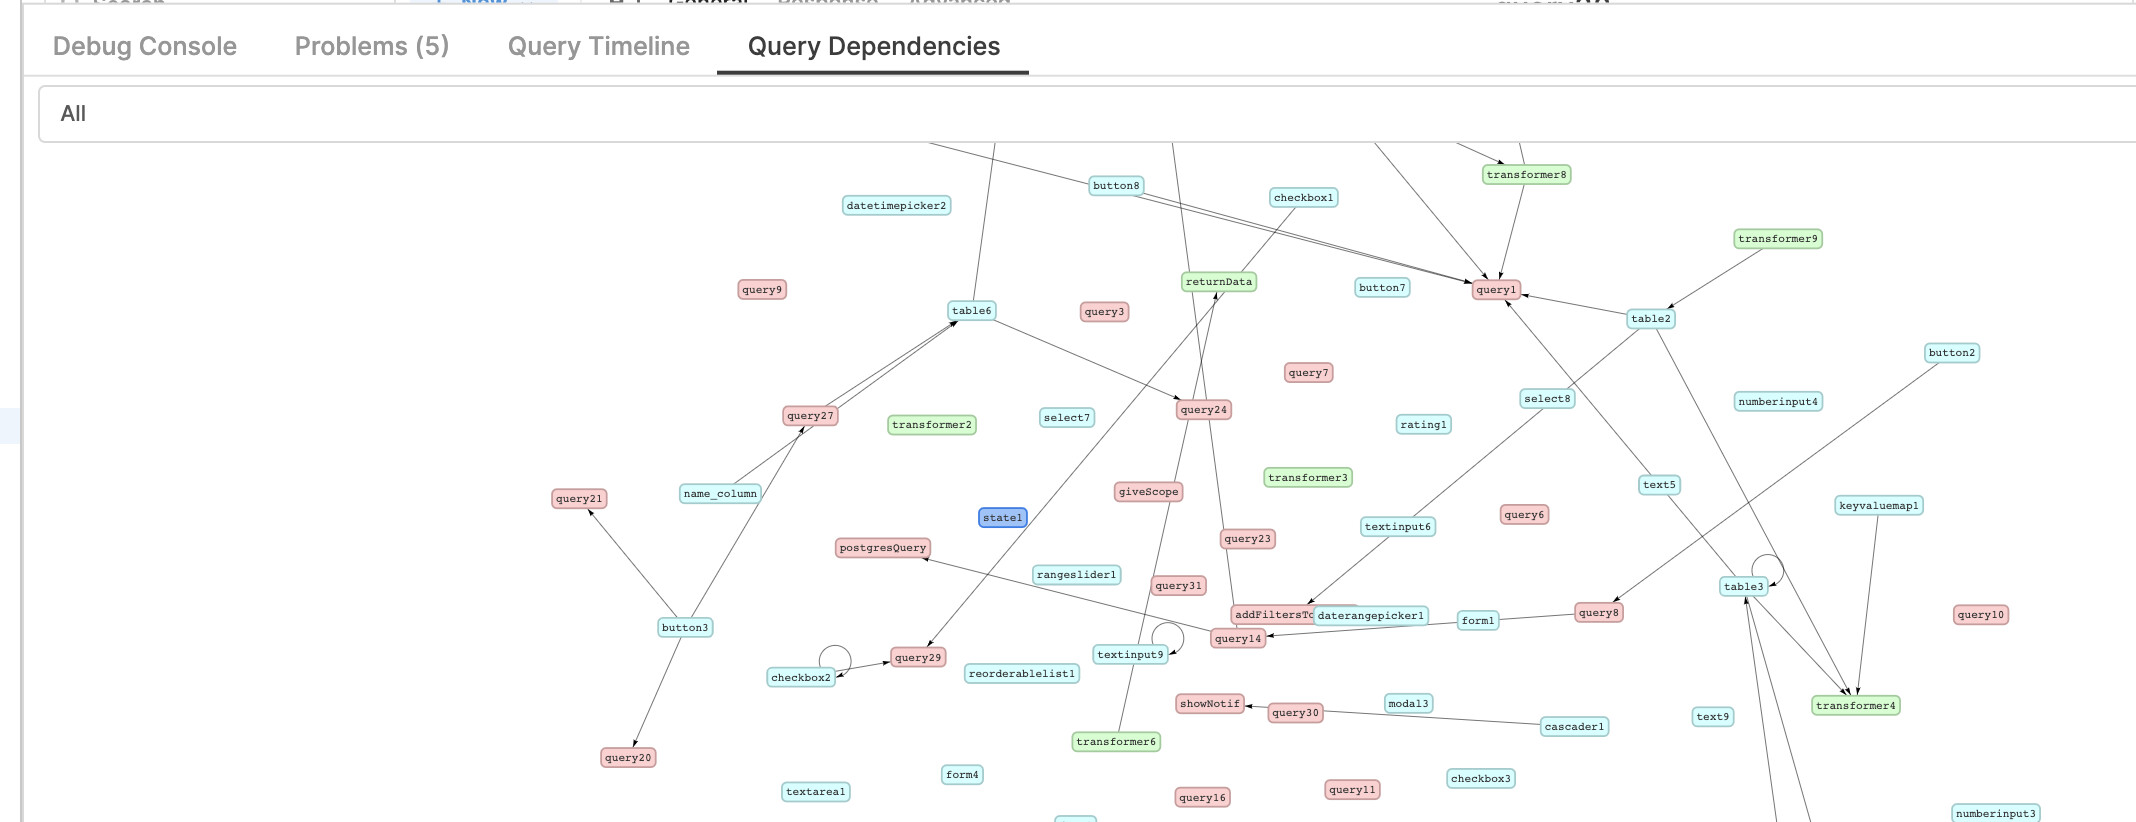
ctrl + ` (backtick) will bring it up. It has a query dependency tab that gives you a graph of your components and queries. You can even select a specific query to see who it's running and who's running it!
In general, the more heavy and complicated the app, the longer it'll take for this panel to come up so you may need to press the hotkey again and wait up to a minute or so. For reference, my not overly complex app (see screenshot) took about 5-10 seconds to pull up the panel!
Ah yes, I have used that. It has been helpful to me but often the graph of query dependencies is a little overwhelming and hard to decipher unfortunately. I put up a feature request a while back with some ideas to supplement the graph and put some order into it.
The query timeline is also helpful, but it only shows what was triggered when, not what triggered what (which onChange triggered a js query which triggered a sql query that triggered another query onSucess and so on.)
What I learned is to avoid this impossible to trace chain of queries and do one of two things:
Use stored procedures. If I have logic where a query adds an invoice and another adds related line_items and another updating a status and so on, put that all in a stored procedure (or make an API end point if I am not using an RDMS). DO NOT try and do all of this in Retool.
Hey @victoria thanks for the reply!
Unfortunately, I have not yet been able to test if it works. I have not yet found a way to press the key combination ctrl+ backtick with my keyboard layout(qwertz). Is there an alternative way to open the developer panel?
Yes i know how to create the backtick character - the problem is that i need to press the shift key as well and with the combination of ctrl + shift + backtick it doesn't work for me
Ah, I see I'm afraid there's no other way to pull this panel up, but we'll definitely keep this in mind when we do begin work on it to make it more of an accessible and polished feature!
We actually retired this feature in exchange for a new debugging panel that will be launching sometime soon Are there any particular issues I can help with at the moment?
 Super helpful!
 And it should be available On-Prem. Is it not showing up for you?

 I'm afraid there's no other way to pull this panel up, but we'll definitely keep this in mind when we do begin work on it to make it more of an accessible and polished feature!