Dynamic colors for standalone progress bars

Hi Retool community!

  1. My goal:
    I'd like to add dynamic coloring for two standalone progress bars. The progress bars' values are connected to values in a retool db table:

  2. Issue:
    The colors it uses seem to be fixed colors. There doesn't seem to be a way to add javascript anywhere:

  3. Steps I've taken to troubleshoot:
    I've searched through the retool forum but whenever dynamic colors for progress charts are mentioned, they're bar charts inside a table component which seem to provide more customization options. I basically want the results mentioned here and here.

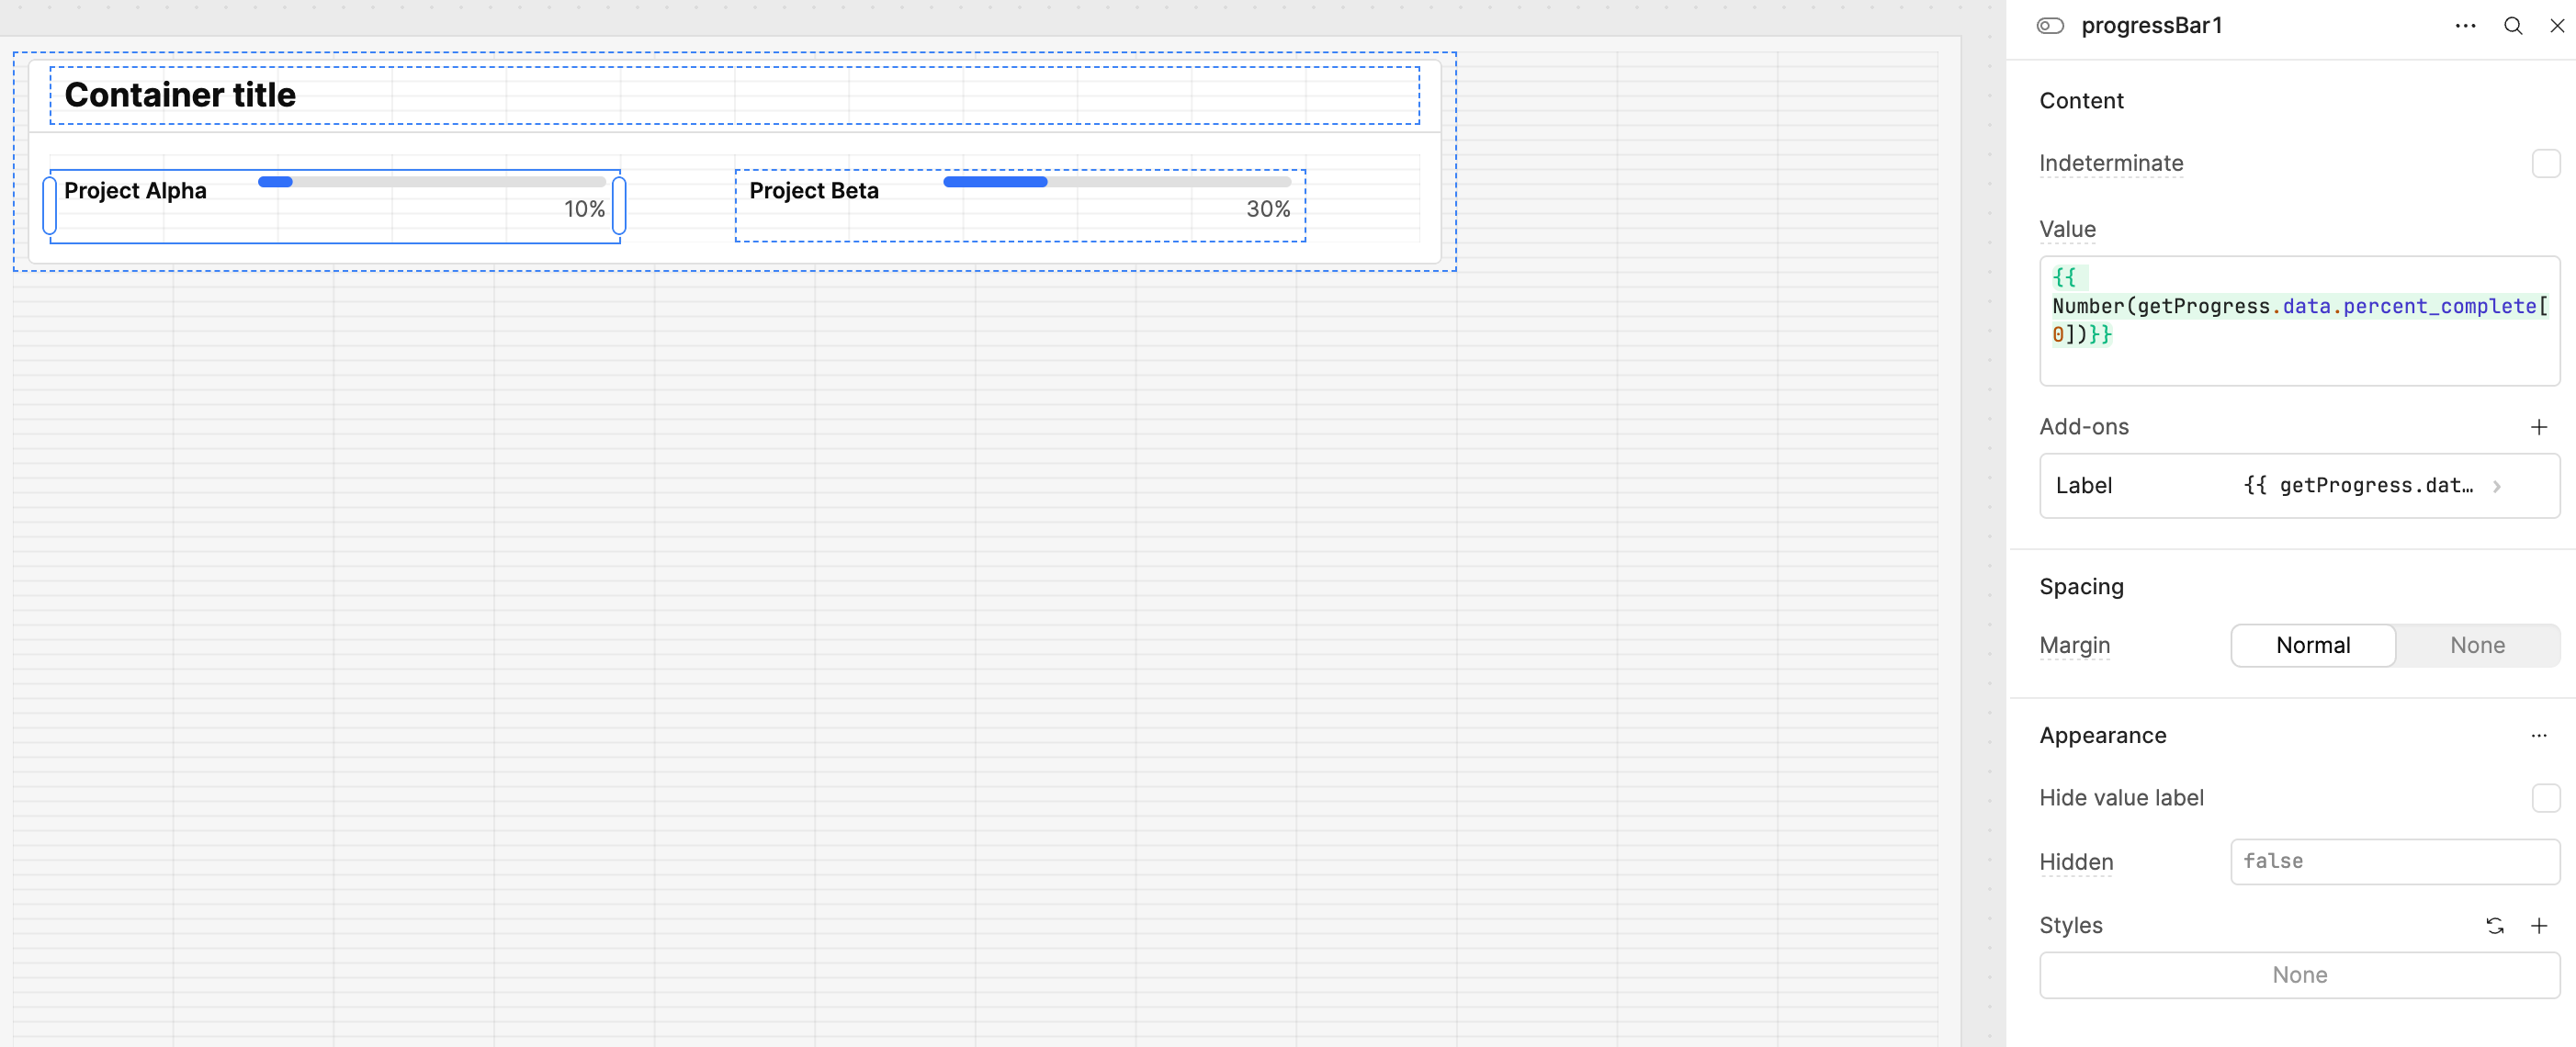
  4. Additional info: (Cloud or Self-hosted, Screenshots) See above for screenshots.

Many thanks for your help!
Fina

1 Like

Hi there @FinaSS,

You can actually click on that break chain icon in the styles section and add javascript within the Progress color setting, see example below:

Is this what you're looking for?

1 Like

Hello @FinaSS, welcome back to Retool Community,

I’ve tested this and found two working solutions for you:

Option 1:
In the Styles β†’ Progress field, bind a JavaScript expression with {{ }} that outputs a valid CSS color:

{{ getProgress.data.percent_complete[0] <= 60 ? "green" : getProgress.data.percent_complete[0] <= 89 ? "orange" : "red" }}

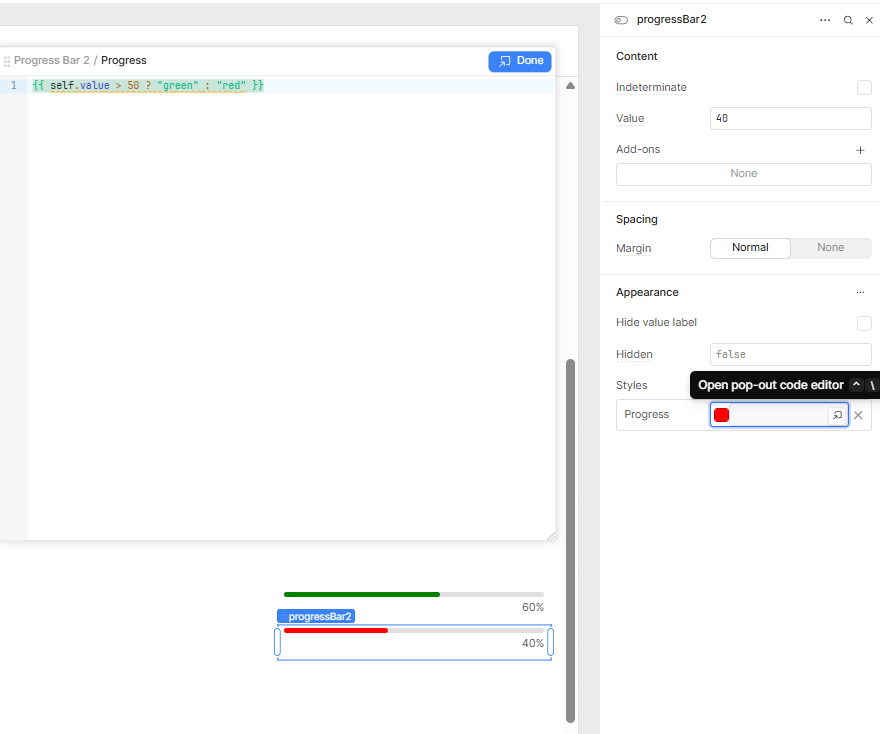
This inline script will dynamically change the progress bar color based on the percent_complete value.
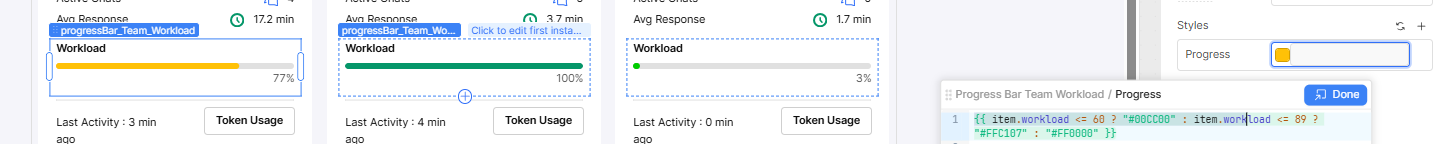
Option 2:
If you’re working with multiple data points (e.g., multiple alpha and beta values), try adding a progress bar component inside a list view and configure it like this:


{{ item.workload <= 60 ? "#00CC00" : item.workload <= 89 ? "#FFC107" : "#FF0000" }}

This inline script dynamically changes the progress bar color based on the workload value.


image

Both methods work perfectly depending on your use case.

2 Likes

Hey @FinaSS!

If I'm understanding your requirements correctly, a post a made about dynamic line colors in plotly graphs may hold the answer you're looking for:

1 Like