Hi everyone! I wanted to share a custom Retool component I built: Vertical Progress Timeline.
I created this to solve a common UI gap in internal tools: teams have milestone/status data in tables, but it’s hard to communicate progress clearly in a timeline format for stakeholders and operators.
What problem does this solve?
In many Retool apps, milestone tracking is usually shown as a plain table or list. That makes it difficult to quickly answer:
-
What’s already done?
-
What’s currently in progress?
-
What’s next?
-
How far along are we overall?
This component turns those rows into a clean, visual, vertical timeline with progress fill and status badges.
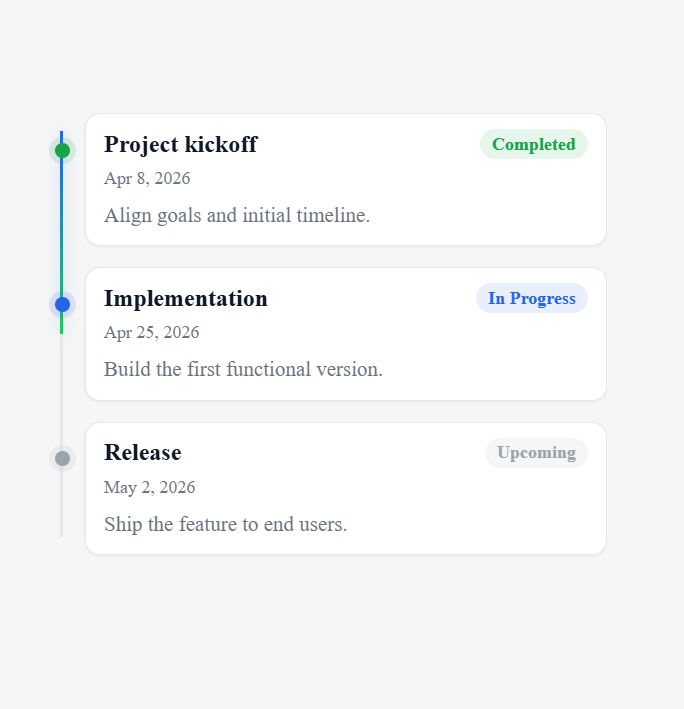
Key features are:
-
Dynamic milestone input via
milestones -
Flexible schema support using
fieldMapping(map any query column names) -
Dynamic status system via
statusConfig(value,label,color) -
Progress calculation controlled by
doneStatuses(single source of truth) -
Sorting controls:
sortBy(none,date,title,status) +sortDirection -
Date formatting tokens:
YYYY,MMMM,MMM,MM,DD,D -
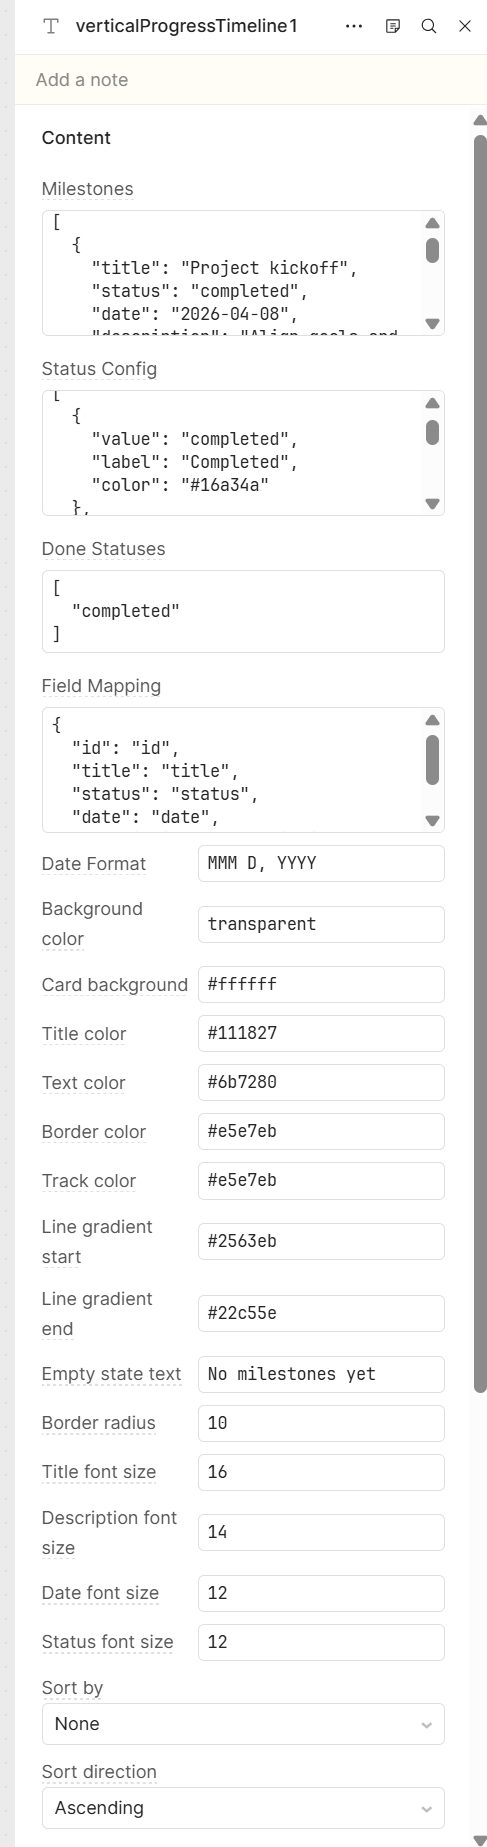
Theming controls in inspector:
-
colors (background/card/title/text/border/track/line gradient)
-
borderRadius -
title/description/date/status font sizes
-
-
Accessibility + interaction
-
card selection by click, Enter, or Space
-
updates
selectedMilestone -
triggers
milestoneClickevent
-
How it works (technical details)
At render time, milestone rows are normalized into a consistent internal shape:
-
fallback IDs are generated when missing
-
unknown statuses fall back safely
-
dates are parsed from common formats / timestamps
Then the component:
-
Applies
fieldMappingto transform incoming query rows -
Normalizes/validates
statusConfig -
Computes completion from
doneStatuses -
Applies optional sorting
-
Renders milestone cards and computes segment-based progress fill to avoid visual gaps near nodes
Here is the Demo link: Vertical Progress Timeline Component Demo