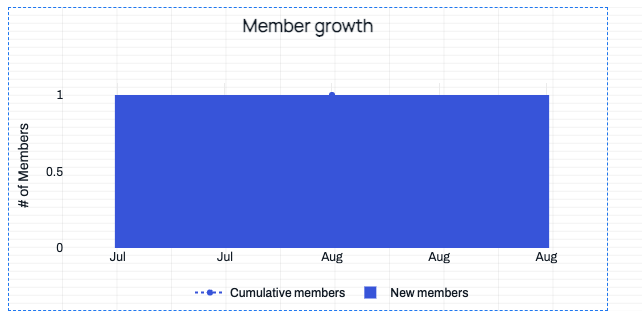
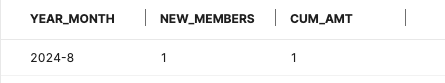
I only want the x-axis tick to appear where I have data. Here's a bad example:
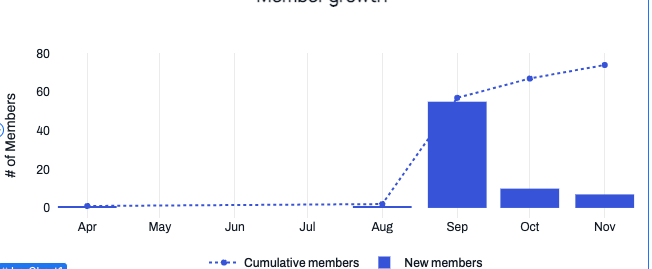
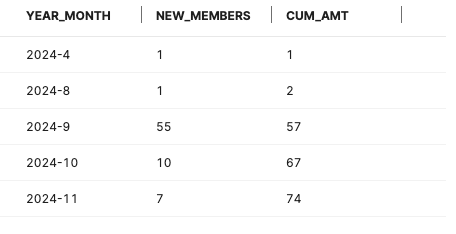
Here's a good example, with the same exact chart, just different data:
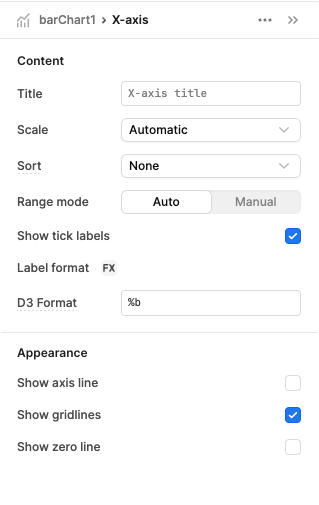
Here's the x-axis controls