davblo
March 11, 2025, 3:34pm
1
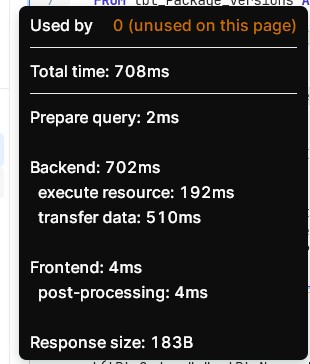
Today I noticed that all of my code, global and local to the pages, is showing as"unused" when I hover over the name.
I checked with some older versions I have in "Trash" and it's the same there. I'm know they were ok when i last used them.
Has anyone seen this effect before? Any idea what can cause it?
davblo
March 11, 2025, 7:14pm
2
Related to this, int he Code are, the "Graph" section is completely empty for all code. So all the dependency information is missing as well.
davblo
March 11, 2025, 7:39pm
3
It would be great to hear from anyone whether it affects them too or whether it's just me.
I found it hard to track down Retool releases & updates, (I'm not using self-hosted) but I found the current version that I am using, down in the bottom right corner...
I haven't yet found whether that was released in the last few days or not.
davblo
March 12, 2025, 12:52am
4
I tried creating a completely new App.
I wrote one simple query
Added a table using the query as source
Data shows up in the table as expected.
But hover over the query name and the popup says - not in use.
davblo
March 12, 2025, 10:28am
5
I found I'm not the only one..
Goal: Expected Behavior - "Graph pane" and "Used by " field in hover tooltip on code sidebar to display correctly.
Steps: Things tried -
Rolling back code/releases
Checking backed up apps
Accessing app on incognito mode
Accessing app on different developer accounts
Accessing app on different browser type (chrome/edge)
Details: We're not on self-hosted retool.
"Graph pane" that used to show the connections between components and code is now displaying as "no connections". Also the "U…
Tess
March 12, 2025, 6:44pm
6
Hi @davblo ,
Thanks for all of these details, and I'm sorry it led to so much troubleshooting on your side
We should have a fix going out soon
Tess
March 13, 2025, 3:33pm
7
It should be fixed. Are you seeing any unexpected behavior?
1 Like
davblo
March 13, 2025, 6:20pm
8
Hi, it seems to be back to normal now. Code usage count is showing up again and the Graph section shows the correct details again.
Thanks a lot!
1 Like