"A dependency graph is a data structure formed by a directed graph that describes the dependency of an entity in the system on the other entities of the same system. The underlying structure of a dependency graph is a directed graph where each node points to the node on which it depends."
In the context of Retool, think of how your app is connected to components, and how those are connected to queries. This connection between nodes can grow extensively. For example, a query can be connected to another query that runs on success, and the response of the latter query can update the text of a button. When we click the button, we may run another query, and so on.
The more dependencies, the more risk for slowdowns, specially when there is an extensive chain of queries that are being ran one after another.
Here is our doc on performance best practices. Having lots of components is a sign we could break our application into two or more, each app can send necessary data to another app by using query params.
That's not super helpful though. I was hoping for a practical way to introspect the chains, specifically as it pertains to Retool.
Dependency chains are something that Retool has introduced through the use of components and declarative programming. As such, it's not really my fault that they occur.
In addition, I can't see how basic use cases (which you advertise as being the whole point of Retool) could create enough dependencies that it would strain your infrastructure. Unless the issue is on the browser side.
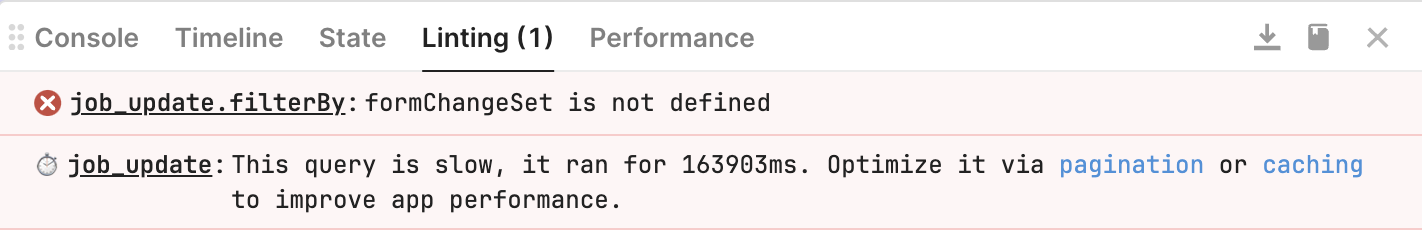
I found the BoldTech article to be basic, watered down and unhelpful. Most of it is common sense. Your own performance page is similarly short on detail and sometimes misleading. For example, the Debug linting page often reports queries taking six seconds when in fact they only take one.
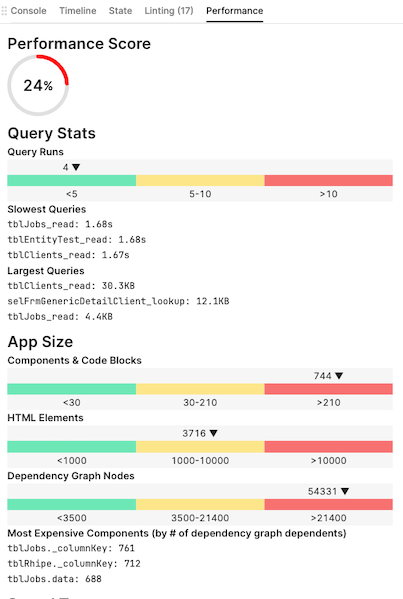
I'll ignore the Performance Score as my app is actually quite fast enough, I was simply confused by the purported terrible performance result.
The 163903ms is a number that increases in real time as you run the query more frequently. That is to say it is a cumulative total, not the actual speed of a single call to the query.
I don't know if this is on purpose to help people spot queries that are using a lot of cumulative time, but if so then the language is very misleading. It would be more appropriate to say something like
This query is using a lot of time, it ran 127 times for a total of 163903ms. Optimize it by reducing the number of times it runs or via pagination or caching.
I'd appreciate if you could consider this as it might help others too.
This is for sure a bug, not a feature. It seems to only happen when a query receives a timeout and we run the query again. We currently have a bug report for it, please let us know if this happened in a different way so we can add it to the report. Thank you for your feedback!