Transform data from Xano

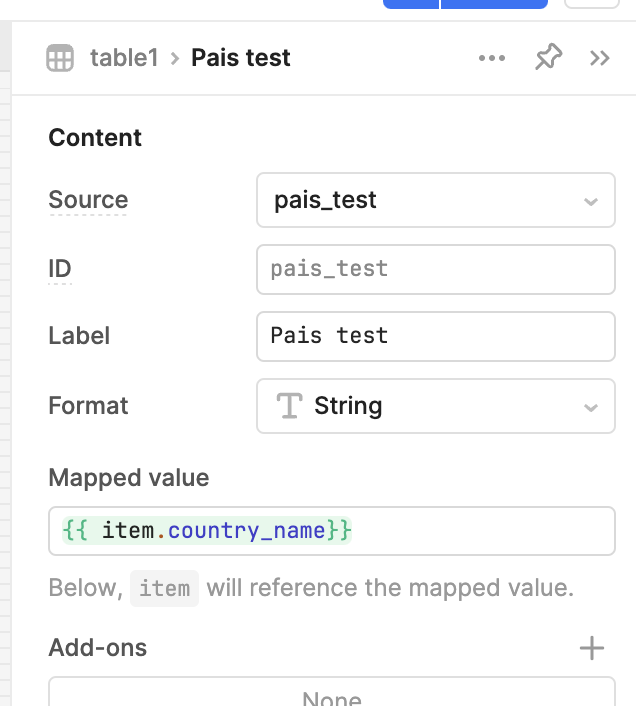
Hello, I am new to using Retool, I am using Xano as the backend of my app and I wanted to modify the format of the response so that only the country name is visible.

  {
    "id": 5414914,
    "created_at": 1670170454000,
    "encuestas_id": 19086,
    "pais_test_id": 12,
    "edad_id": 4,
    "primera_estancia": 0,
    "recomendaria": 0,
    "es_cliente": 0,
    "recepcion": 0,
    "limpieza_hab": 0,
    "serv_tecnicos": 0,
    "serv_bar": 0,
    "serv_restaurante": 0,
    "cocina": 0,
    "cocina_almuerzo": 0,
    "cocina_cena": 0,
    "cocina_desayuno": 0,
    "amabilidad_personal": 0,
    "guest_service": 0,
    "anim_diurna": 0,
    "anim_nocturna": 0,
    "entretenimiento": 0,
    "tiendas": 0,
    "spa": 0,
    "calidad_precio": 0,
    "ha_viajado": 0,
    "donde_reserva": 0,
    "_pais_test": {
      "country_name": "EEUU"
    }```

![Captura de Pantalla 2024-01-08 a la(s) 12.18.01|688x388](upload://o37NfA9qSprBnJEHr0R5LyeNINT.png)

Hi Pablo - welcome to the community!

I assume you want Pais test field to have values like EEUU, not { "country_name": "EEUU" }.

In this case, adjust this field in two steps.

First, click Pais test field in your table settings:

Then, set Mapped value of this field to be like {{ item.country_name }}, like this:

Hope this helps

1 Like

It's works!
Thanks @preshetin

Great @mosca I'm happy it worked! Can you mark my post as a Solution? So that those who search for similar problem could easily find the solution

Done!

1 Like

Hello @preshetin, I wanted to see if a chart could be made that evaluates the % of countries in the query.
For example USA 25%, France 16% etc.
I can't find a way to do it in a pie chart

Hola @mosca, I sent you a private message since your chart question looks unrelated to this topic. Please check your inbox