We are noticing all of retool's cloud hosted support js and css links are refetching with HTTP 200 vs. HTTP 304 per same app refresh. We are digging into this due to slow app load and refresh time.
E.g. https://retool-edge.com/137943.979f2c2e2ef7b86c63de.js
Going directly to this js repeatedly I get the expected HTTP 304 due to cache control and no change since.
But this same js fetched within a retool app we build is always a refetch with HTTP 200 instead.
Any idea? Due to this it is causing our app to load very slowly every single time.
Thanks for any help in advance!
Hey @michaell!
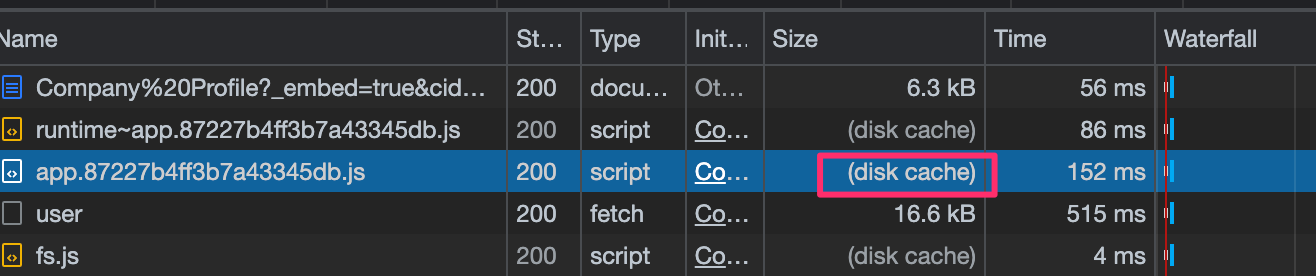
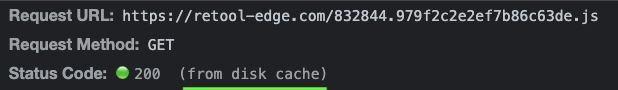
Retool tends to fetch cached JS which will return a 200 but should actually be faster than a 304 in which case you should see a message similar to the following in your browser's networking tab:
Is that not the case for you?
As for the slowness - are you seeing it accross all of your apps or is it just in particular ones? We might be able to take a closer look at what's going on there.
I also want to drop our doc page on building performant apps for reference if you haven't checked it out already, it has some really nice Retool-specific tips!
THANKS @Kabirdas for your reply and clarification! Yes that's what I'm seeing (disk cache) with status 200, and agreed that it should be faster than 304. However, do you know then why these supposedly disk cache js and css would still register as 'waiting for server response' in chrome network?
Overall, we narrow down our 3 queries triggered for the app upon load to be around 1100 ms in total (600ms+300ms+200ms), but overall app load time still around 9-10s which is what we are trying to narrow down and tune for.
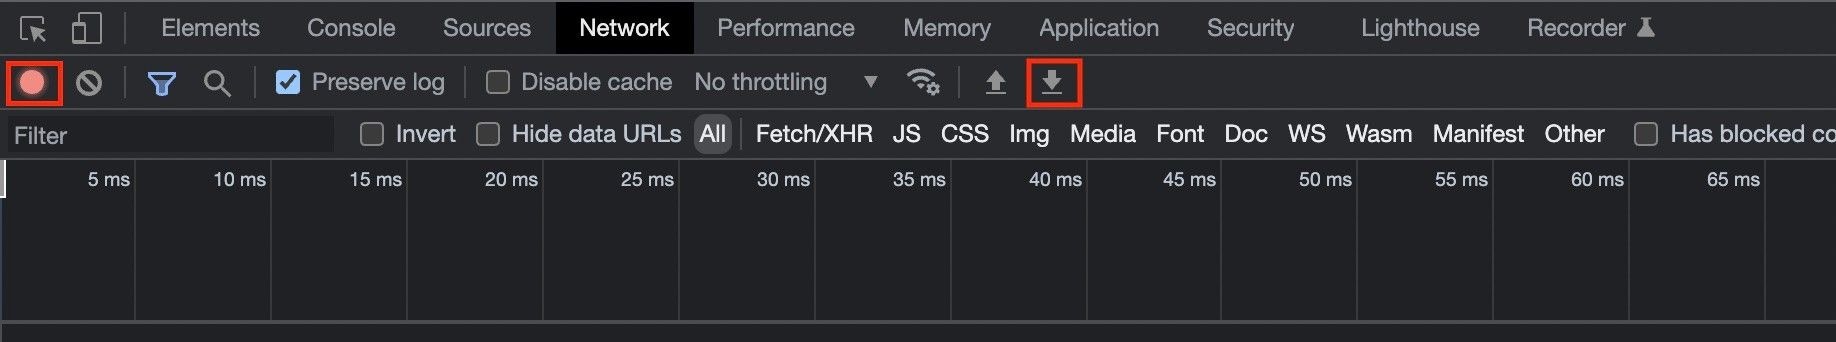
I'm not sure why those would register as 'waiting for server response'  could you share a screenshot of your network panel or a .har file that includes those requests? Note: If you can share the .har file you'll want the network tab open and recording when refreshing the page in order to get a full snapshot.
A JSON export of your app might also help with debugging!
If any of this is information you're open to sharing but rather not do so on the forums you can also write in to us through intercom in your Retool instance 
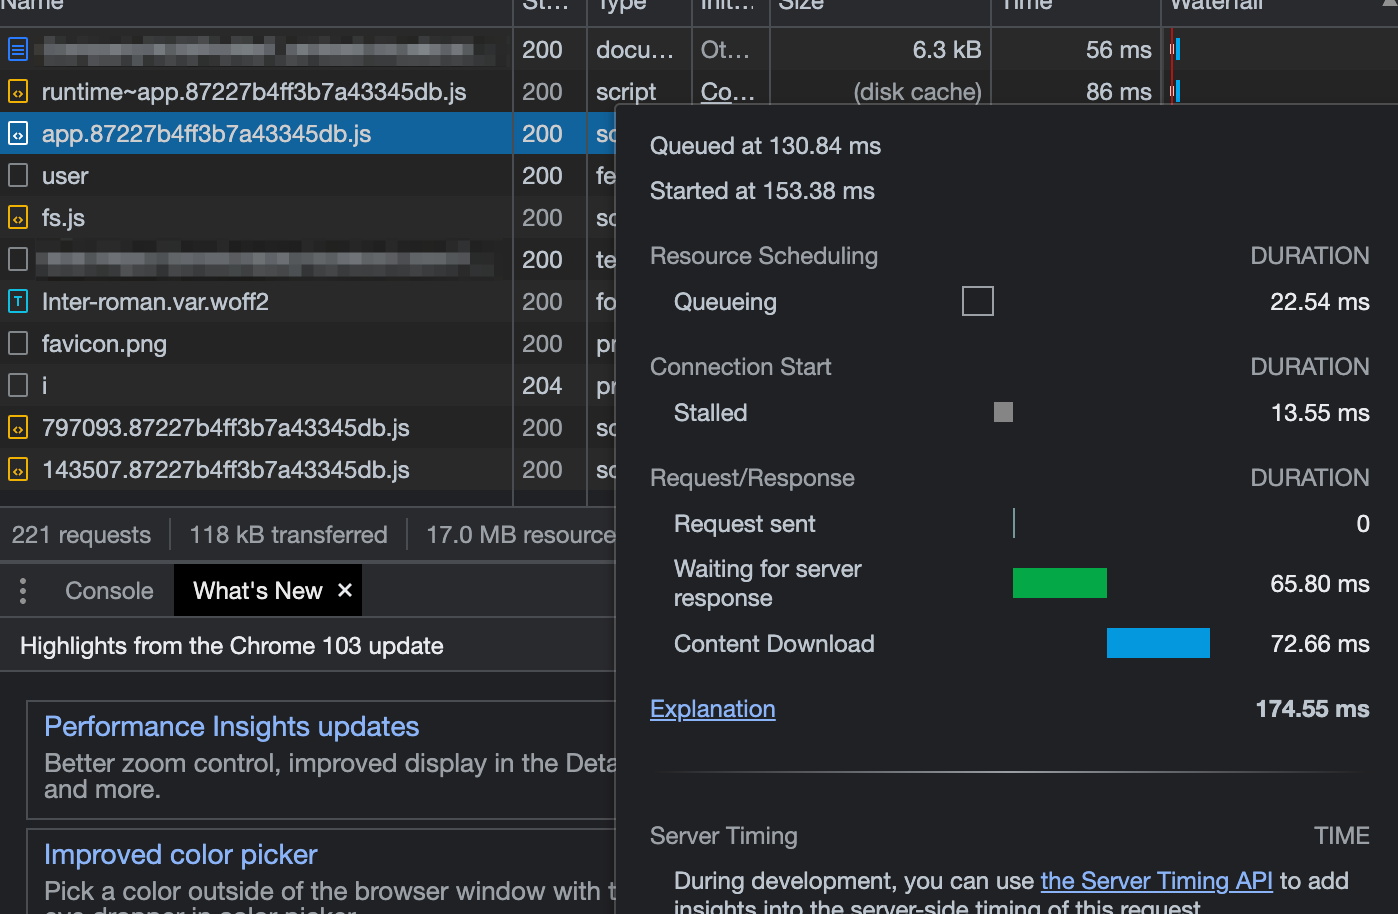
Here's an example of 'waiting for server response' for a '(disk cache)'
Both the waiting for server response and content download times there are much longer than I'd expect are you seeing this across all scripts that are being loaded?
It sounds like you've already tried this from multiple accounts but it may still be worth clearing the browser cache to see if that helps.
We can also try stepping into your app from our end to take a closer look if you'd like 
Thanks for getting back @Kabirdas . Yes even after clearing cache still seeing the same waiting. Tried this from both Chrome and FF on my Mac. Let us know how we can arrange for you to step into our app to take a closer look, and what impact, if any, doing that troubleshooting would impact the current production app.
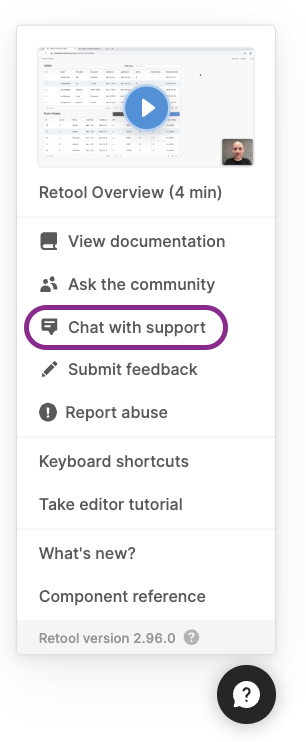
The best way to do that is to write in to us through the in-app chat:
From there we can see the domain you're writing in from and if you provide us with the name of the app we can, with your permission, step in using one of our designated support accounts. We won't make any changes to your production app, the most we'll do is step in to take a look, if we need to make any edits for debugging purposes we'll create a copy to do that in within your org.