Hi @Francois_Hamon Thanks for reaching out! As far as native components, the Plotly component is currently the only solution we offer for charts. The other option would be to spin up your own custom React component.
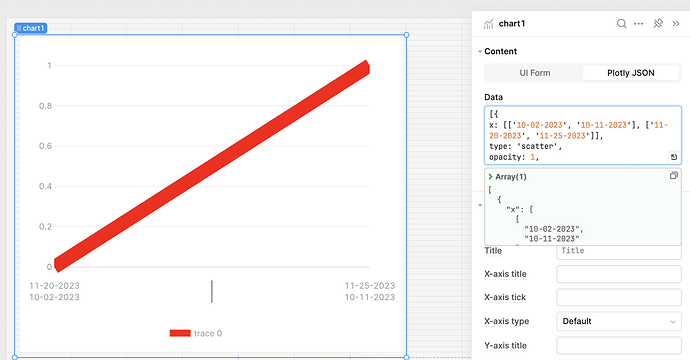
Using the code you provided, I'm able to at least get something on the chart (with hardcoded dates), but I'm not sure that this is quite what you're looking for:
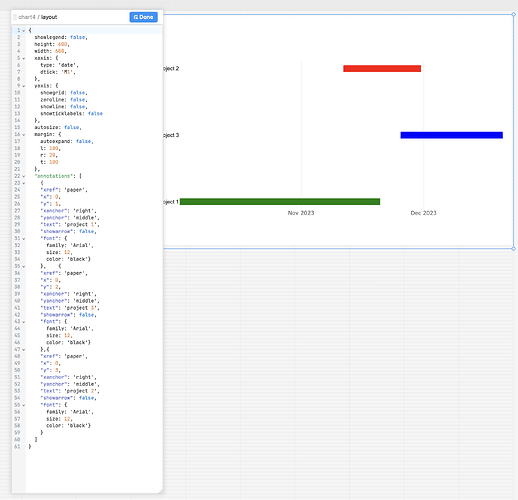
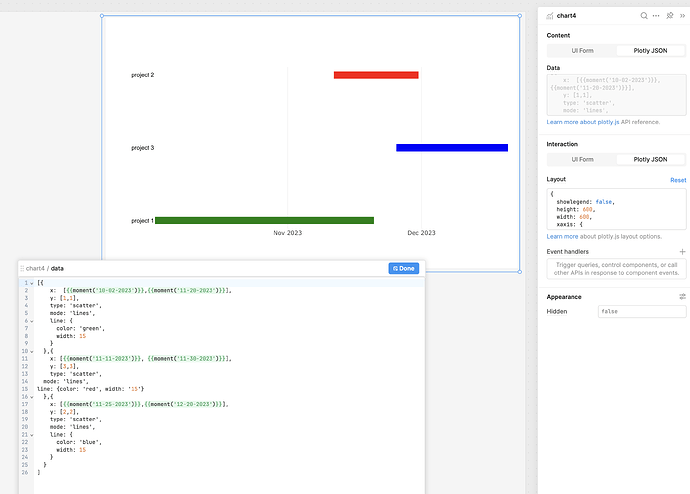
You might be able to use a more detailed Plotly chart, such as this example I made using these examples from the plotly docs:
Otherwise, you might find some of these custom gantt chart posts helpful:
Topic 1, Topic 2


