I am trying to make a map using Python from an SQL query, i.e. query1.data.
I have the code for making a plot or map using plt.show() but this isn't doing anything in the workflow, it only returns null or "result is not JSON serializable." Any examples for making a chart in the workflows feature using Python?
Hi @jaytul
Never tried, but I guess the image should be encoded in base64 string before to return it in a js object such as return {img: "your base64 image"}.
This way you can convert back or just use it as source in a Image component.
Hope this help
tried both of these, not sure what to return or the format required, nothing in the documentation.
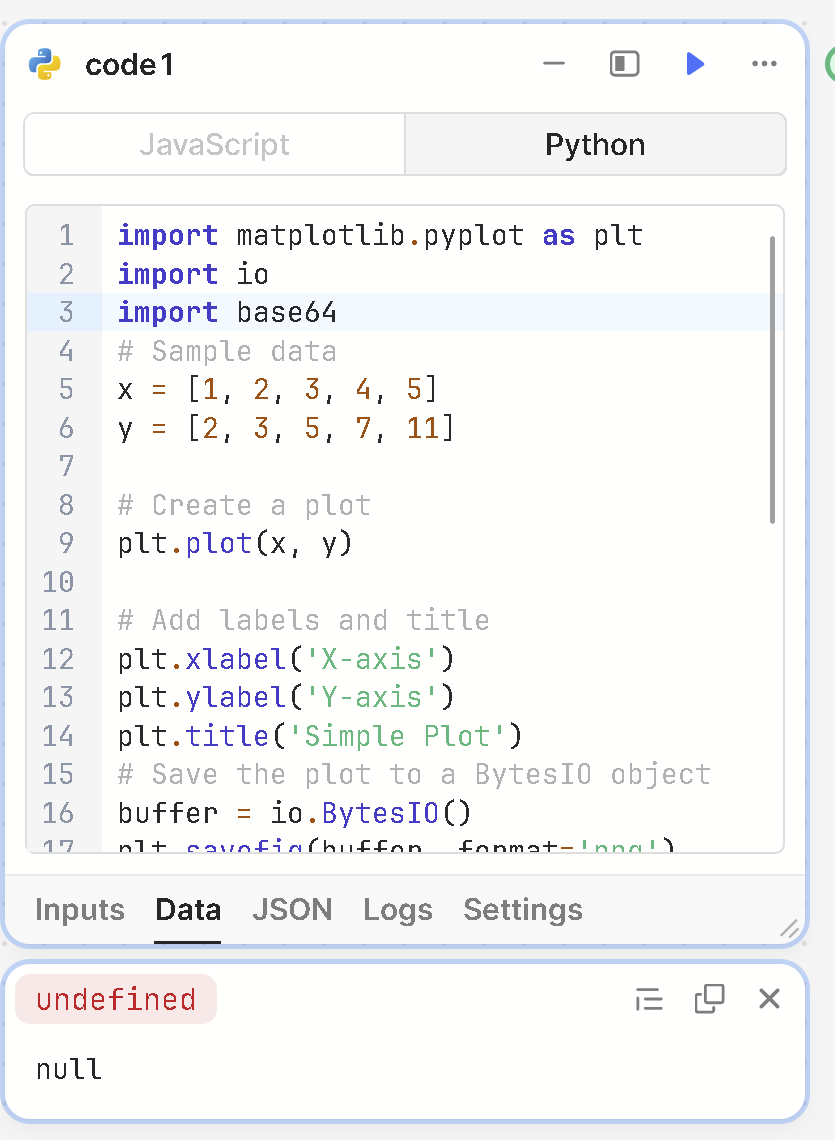
import matplotlib.pyplot as plt
import io
import base64
# Sample data
x = [1, 2, 3, 4, 5]
y = [2, 3, 5, 7, 11]

# Create a plot
plt.plot(x, y)

# Add labels and title
plt.xlabel('X-axis')
plt.ylabel('Y-axis')
plt.title('Simple Plot')
# Save the plot to a BytesIO object
buffer = io.BytesIO()
plt.savefig(buffer, format='png')
buffer.seek(0)

# Convert the plot to a base64 encoded string
plot_base64 = base64.b64encode(buffer.getvalue()).decode('utf-8')

# Display the plot as a JSON serializable string
plot_json = {"plot_base64": plot_base64}

print(plot_json)

###

import pandas as pd
import matplotlib.pyplot as plt

# Sample DataFrame
data = {
    'user_id': [108, 109, 110],
    'latitude': [19.0292889, 19.0324242, 19.0367378],
    'longitude': [73.0986117, 73.0252039, 73.0200738]
}
df = pd.DataFrame(data)

# Extract latitude and longitude coordinates
latitude = df['latitude']
longitude = df['longitude']

# Create scatter plot
plt.figure(figsize=(8, 6))
plt.scatter(longitude, latitude, c='blue', s=100, alpha=0.7)

# Add labels to each point
for i, txt in enumerate(df['user_id']):
    plt.annotate(txt, (longitude[i], latitude[i]), fontsize=10)

# Add title and labels
plt.title('User Locations')
plt.xlabel('Longitude')
plt.ylabel('Latitude')

# Show the map
plt.grid(True)
plt.show()
Workflows currently doesn't support showing Python charts or images within the Python block. Could you return plot_json instead of printing it? That way it can be used by an Image component in the app. It looks like you have the right code overall.
thanks, this produced an output. How to access this output and return this in the image component? In image component, is the output accessible via JS image source and pasting the file object in the file object field?
You'll have to add a webhook response block to your workflow and return the data in the response. Make sure to enable the webhook trigger in the triggers tab in the left. Afterwards, call the workflow from your app and use the response data with the JS image source as you mentioned.
1 Like