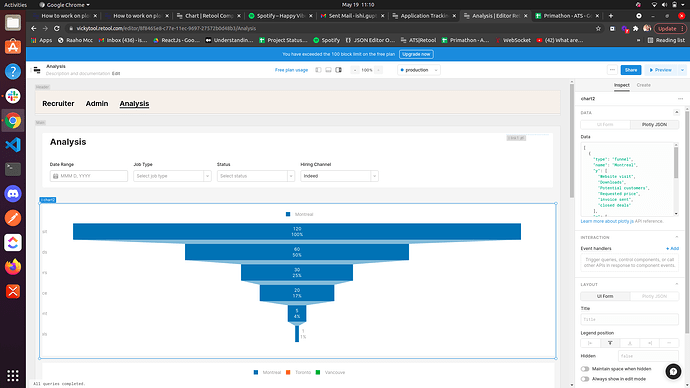
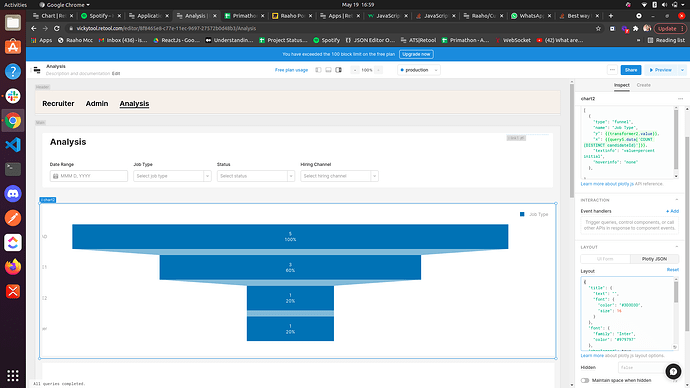
@ScottR It is also not working on enterprise plan, My friend has one
The only other thing that I can see different between your set up and mine is that your Google Chrome browser needs an update!
@ishi8
Hey there ![]() It looks like you have hit your 100 block limit. 1 block = 1 component, 1 query or 1 transformer. This means you won't be able to create any new blocks on this plan level. Feel free to reach out to support with any questions!
It looks like you have hit your 100 block limit. 1 block = 1 component, 1 query or 1 transformer. This means you won't be able to create any new blocks on this plan level. Feel free to reach out to support with any questions!
@lauren.gus I also tried this code on enterprise plan with one of my friend, it is not working for that too
As mentioned by @ScottR, I am able to get this working using the sample code @Pawan shared:
If your friend with the Enterprise plan is running into issues definitely have them reach out to support ![]()
How we can make this funnel dynamic according to the filters.
Examples- we want to count of all the candidate status(sde1, sde2,....) according to the hiring medium eg. linkeldn
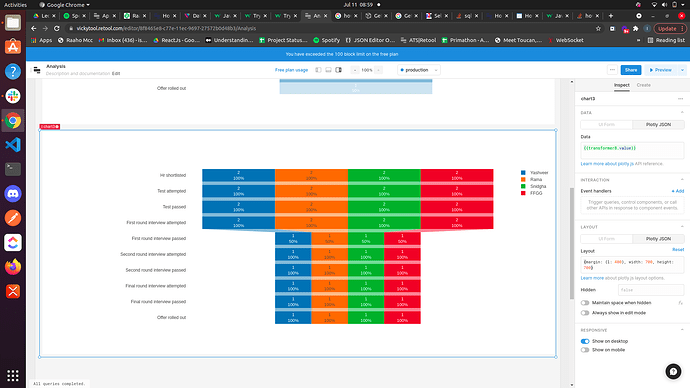
@lauren.gus Is there a way to decrease the width of funnel and make the y -axis test be in alignment
The examples in the plotly docs have different layout options:
Here is an example layout from those docs:
As for setting filters, here is a great resource that uses an example with date filtering!
How can we instead of making boxes, for all 4, Can we write it above of every colour on horizontal row.
Hey @ishi8!
Going to refer to the other thread on this for the first question.
As for the second, plotlyjs has some options for changing the legend of your chart here you might also want to take a look at their docs on adding annotations to your chart. It sounds like the latter might be what you're looking for.
Let me know if that helps!


