In honor of Bitcoin hitting $50,000 for the first time a couple weeks ago, I wanted to share a cool Bitcoin Retool project with you guys that I've been working on ![]()
You can check out the project here: https://www.bitcointreasurycharts.com/
Recently, Bitcoin has seen more and more corporate interest, and this will most likely be pivotal to its growth moving forward.
The general sentiment is that, as more companies add Bitcoin to their balance sheets, it'll create a positive feedback loop - the price of Bitcoin will increase and as it does so, more & more companies will be enticed to buy BTC, further increasing the currency's price and signaling to other companies that it's a sound investment. However, having a volatile asset on your balance sheet means potentially increasing the volatility of your stock price. Thus, the general correlation between BTC and a stock price is important for shareholders, and those looking to gain exposure to Bitcoin through these companies, as well as CFOs looking for empirical data about other companies who've added BTC to their balance sheet. Additionally, stocks with Bitcoin on their balance sheet can act as an intermediary for those looking to participate in options on Bitcoin.
I couldn't find any sites that charted theses correlations so I decided to take a stab at it using Retool!
How
1. The Backend setup
Knowing that, I wanted to make this project as dynamic and as quick as possible, I decided to move the calculations and complexity to Google sheets. I chose Google sheets because I knew that I didn't have that much complex or unstructured data and wanted quick access to it, as I didn't plan to update it using Retool, nor wanted to faff around with editing more complex databases. I also knew that I could use Google finance equations to chart daily stock prices & have them automatically updated every 20 minutes.
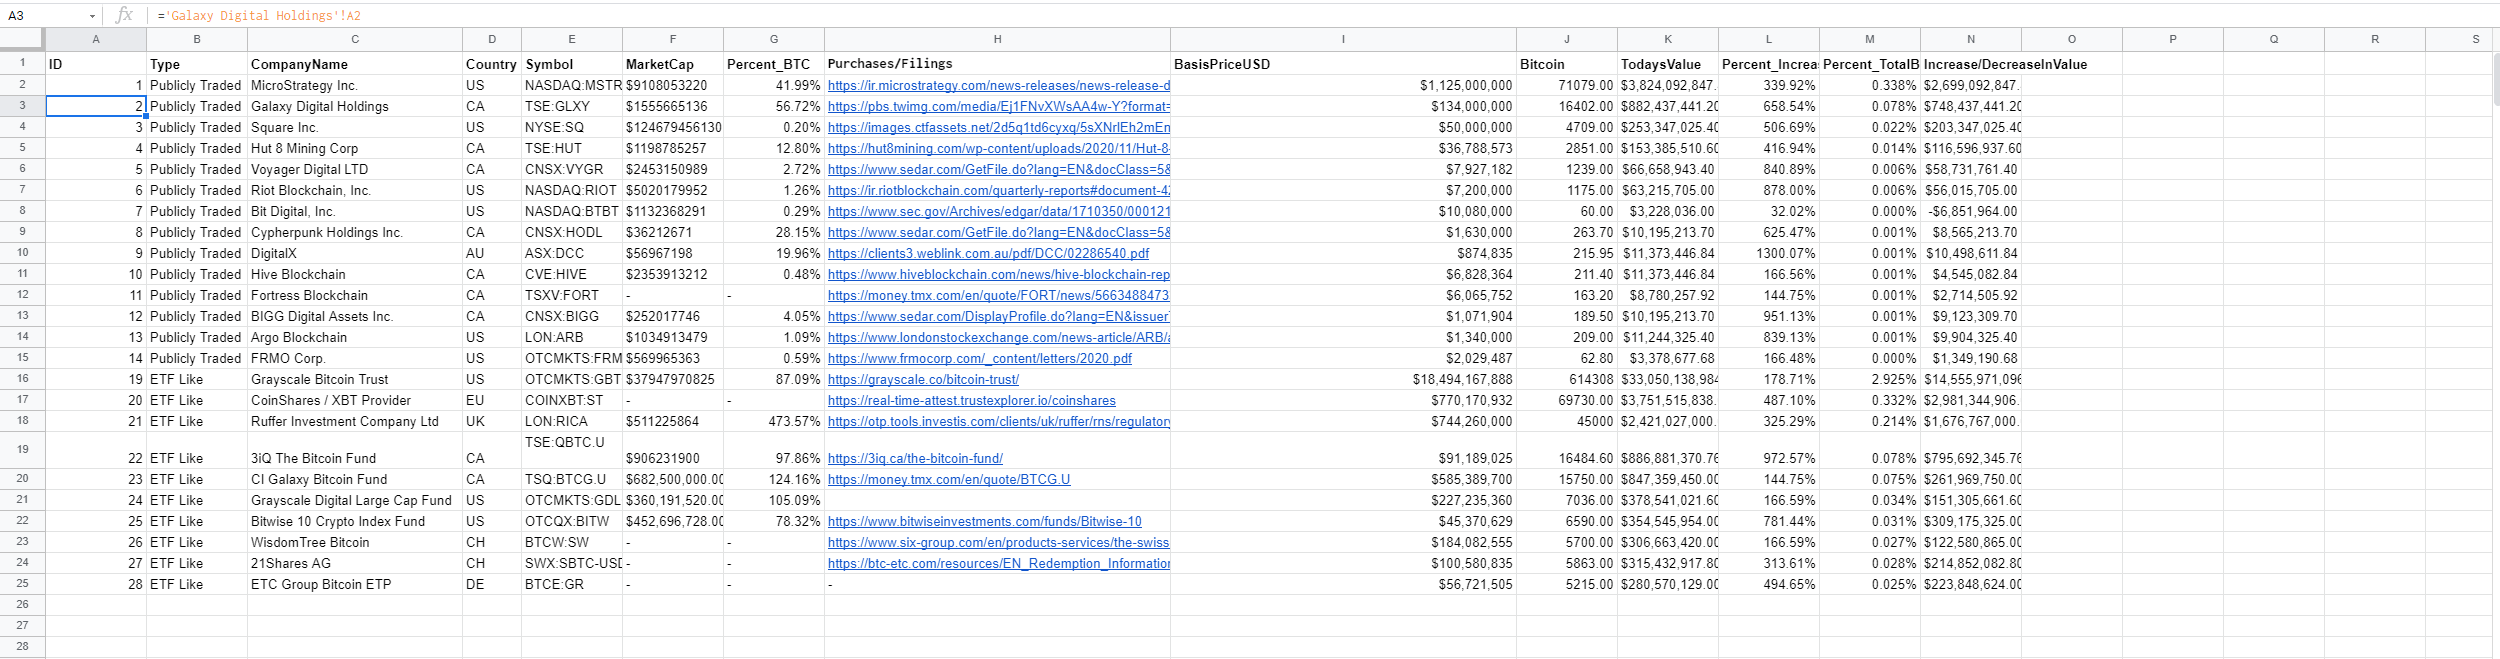
Above is my main sheet - to keep things as quick & neat as possible, this sheet uses sheet references to pull in information from separate sheets (say sheet one more time), each named after one of the companies invested in BTC. My Retool table only pulls in information from this main sheet. This way my front end doesn't get overloaded with data and my Retool app stays super speedy
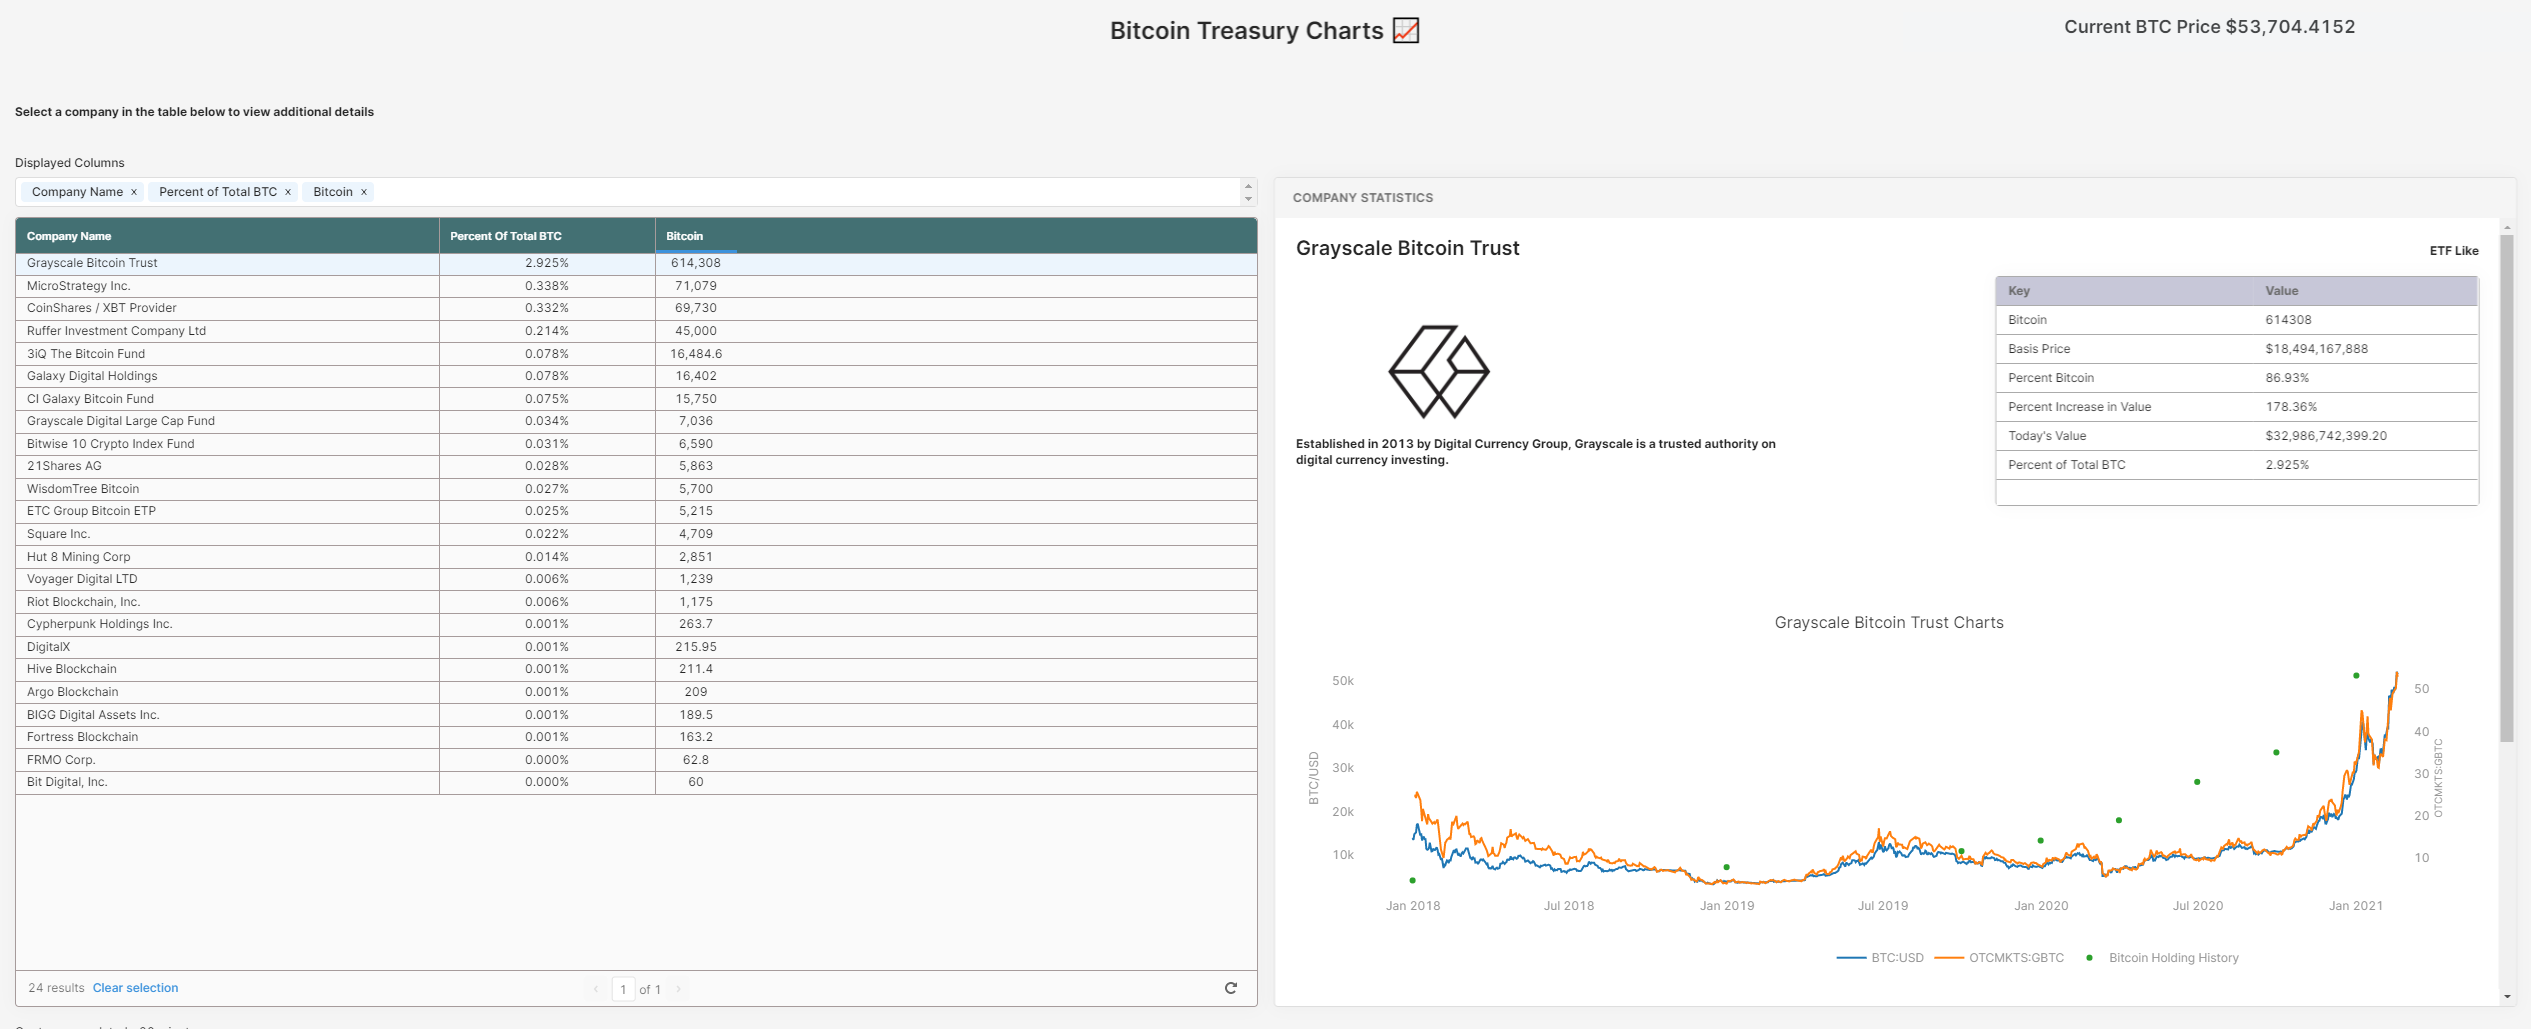
I make use of a pretty common & useful Retool dashboard layout as my front end (see first picture). As mentioned, I use a single Google sheets read query to pull in my main table. When a user selects a row in the table, I use a second query to pull in the associated Sheet by the Companies name. Here is a screenshot of my second query:

Below shows you what it looks like in my Google Sheet tabs. I'll probs have to change my setup (like changing to an actual DB) when more than ~50 companies add Bitcoin to their balance sheets, but this works for now

In my first iteration of the app, I pulled in nearly all information (including stock points) in one query which took maybe 9 or 10 seconds to load. This two query strategy shortens it to 1 or 2 seconds and might be helpful in your Retool apps in some fashion if they have a large amount of data.
As for the company pages, I pretty much just dump all of the information that I'd like to have into separate columns. Here is an example below.
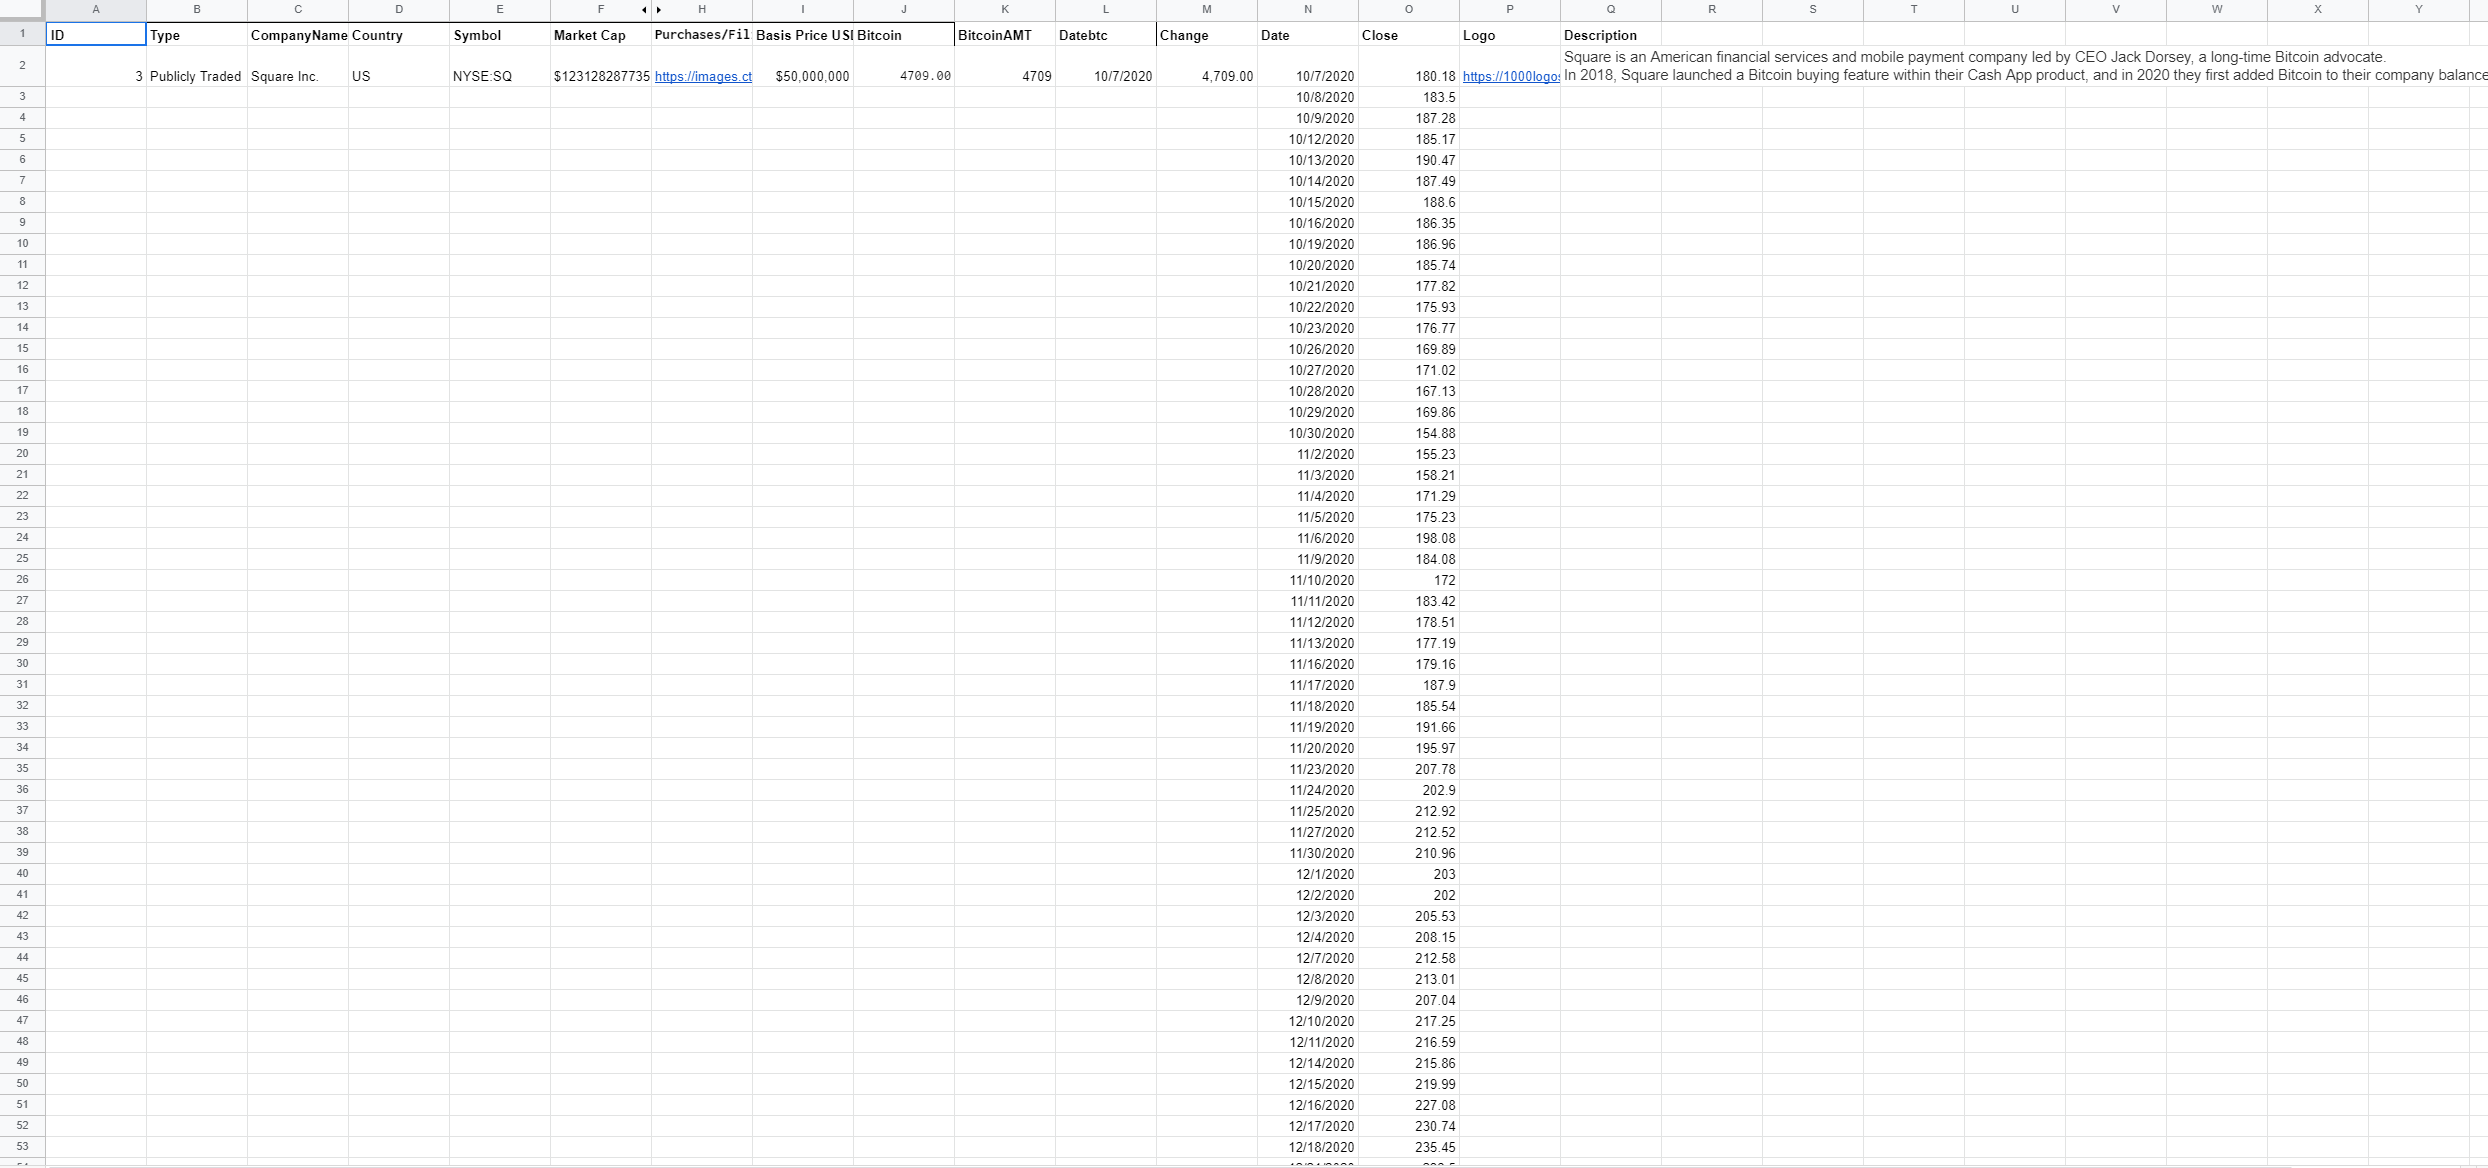
For the stock price charts, I use a simple Google Finance formula to display the stocks price for each day since the purchase of Bitcoin: =GOOGLEFINANCE(E2,"price",L2,TODAY()). The rest of the information I scrounged from the web ![]() . I'm still missing quite a bit, but Retool has enabled me to focus on collecting the data instead of debugging/creating the app.
. I'm still missing quite a bit, but Retool has enabled me to focus on collecting the data instead of debugging/creating the app.
Using my second query, I pull this information to be used on Retool!
Front End
My Retool app is fundamentally only two components, the table with data about each company and a container to display more details about the selected company. I'll walk through a couple sections of the front end setup for those that are curious.
Dynamic Plotly Chart
While Retool still advertises their Plotly component as a beta feature, I've found that these are some of the most useful components in my apps. To make the chart comparing the selected company's stock price to BTC while also displaying their purchases, I started with a basic plotly chart, and edited the JSON according to the Plotly Javascript Docs.
Here is my data Tab:
Click to View
[{
x: {{ _.keys(btc.data.bpi) }},
y: {{ _.values(btc.data.bpi) }},
name: 'BTC:USD',
type: 'scatter',
},{ x: {{dateFormatting.value}},
y: {{yaxis.value}},
name: {{table1.selectedRow.data.Symbol}},
yaxis: 'y2',
type: 'scatter'},{ x: {{dateadded1.value.Date}},
'y': {{dateadded1.value.Amt}},
name: "Bitcoin Holding History",
yaxis: 'y3',
type: 'linear',mode:"markers"}]
For this to work properly, I had to change the dating format to be the same across the board: I did this in a transformer using moment, a JS library that Retool makes available:> var x = {{companyselecttable1.data.map(d=>d.Date)}}
return x.map((i) => moment(i).format('YYYY-MM-DD'))
Here is my Layout Tab
Click to View
Here is my layout tab: "title": {
"text": "{{table1.selectedRow.data.CompanyName}} Charts",
"font": {
"color": "#3D3D3D",
"size": 16
}
},
"font": {
"family": "Inter",
"color": "#979797"
},
"autosize":true,
"showlegend": "true",
"legend": {
"xanchor": "free",
"x": 0.45,
"y": -.2,
"orientation": "h"
},
"margin": {
"l": 60,
"r": 70,
"t": 64,
"b": 32,
"pad":1
},
"hovermode": "closest",
"clickmode": "select+event",
"dragmode": "select",
"xaxis": {
"title": {
"text": "",
"standoff": 16,
"font": {
"size": 12
}
},
"type": "-",
"tickformat": "",
"gridcolor": "#fff",
"zerolinecolor": "#fff"
},
"yaxis": {
"title": {
"text": "BTC/USD",
"standoff": 6,
"font": {
"size": 12
}
},
"showgrid":false,
"type": "linear",
"tickformat": "",
"automargin": true,
"fixedrange": true,
"zerolinecolor": "#DEDEDE"
},"yaxis2":{
"title": {
"text": "{{table1.selectedRow.data.Symbol}}",
"standoff": 6,
"font": {
"size": 10
}
},
showgrid:false,
fixedrange:true,
type: "linear",
tickformat: "",
zerolinecolor: "#FFA500",
overlaying: 'y',
side: 'right',
position: 1
}, "yaxis3":{
"title": {
"text": "BTC Held",
"standoff": 10,
"font": {
"size": 10
}
},
showgrid:false,
fixedrange:false,
type: "linear",
tickformat: "",
zerolinecolor: "#FFA500",
overlaying: 'y',
side: 'right',
position:1,
visible : false,
}
}
This was taken all from plotly's docs - mainly this: Multiple axes in JavaScript
Key Value Map
This data pulls directly from the table and dynamically changes according to the selected row.
Here is its Data Value:
Click to View
{
"Bitcoin": {{table1.selectedRow.data.Bitcoin}},
"Percent Bitcoin": {{table1.selectedRow.data.Percent_BTC}},
"Percent Increase in Value": {{table1.selectedRow.data.Percent_Increase_In_Value}}, "Today's Value": {{table1.selectedRow.data.TodaysValue}}, "Percent of Total BTC":{{table1.selectedRow.data.Percent_TotalBTC}}, "+/- in Value": {{table1.selectedRow.data['Increase/Decrease In Value']}}, "Basis Price": {{table1.selectedRow.data['BasisPriceUSD']}},"Market Cap":{{table1.selectedRow.data['Market Cap'] }}
}
App Tricks
-
Displayed Columns Option - This feature allows users to select the columns they'd like to display in the table. To do this in your own app, you'll want to add a multiselect component & set the values to be equal to the column names of your table. Next, set each table column to "Dynamically show key" and set the value to be: {{_.includes(multiselectcomponentname.value,"ColumnName")}}. This makes it so that whenever your column name is selected, it appears in the table- ultimately giving users the ability to show/hide a table's column.
-
Full Screen - I knew that I wanted the app to be full width so I set a text element to: ".retool-canvas { max-width: none !important; } " - you can check out a post I did about custom CSS HERE and Retool's CSS post HERE
General Takeaways & Thoughts
All-in-all, what I think this project highlights best is the speed at which you can create apps with Retool. From start to finish this project only took about ~20 hours to make - most of that was collecting data for my app to display. I was also able to create this app using only a limited amount of JavaScript - only fixing small formatting problems or adding references.
As for negatives, the only sticking points I'm finding with my apps is query times and the lack of customization with some pre-made components.
On a different note, I think that Retool could help empower traditional small- to medium-sized companies ,who currently face an increasingly saturated market of software products that are aimed to improve their business and internal processes. The common penny-wise pound-foolish piecemeal approach of uncalculated tech adoption often sees these non-technical companies choosing inappropriate tech solutions, ultimately leading to overly complicated processes and additional cost. When the person who feels the pain is also the one empowered to be a part in building the solution (which low-code environments like Retool enable), I think that unique and extraordinarily powerful tools (and ultimately successful companies) would be the result. As services like Retool keep reducing their learning curve, I feel that more & more non-technical companies will forego these expensive software solutions and just build their own personalized tool based off of their own intuition & needs. If its as easy as plopping a table down, connecting a query and making an action (also not having to navigate someone else's UI), companies would be silly not to use it. IDK how far we are off from that, but I feel like Retool is a step in the right direction.
I also think that there are a lot of opportunities for different forms of Retool first entrepreneurship outside of the internal tools space.
Hope this quick write up can be of use to somebody!
