Add the option to create a custom aggregation through JavaScript to the summary row dropdown as shown in image.
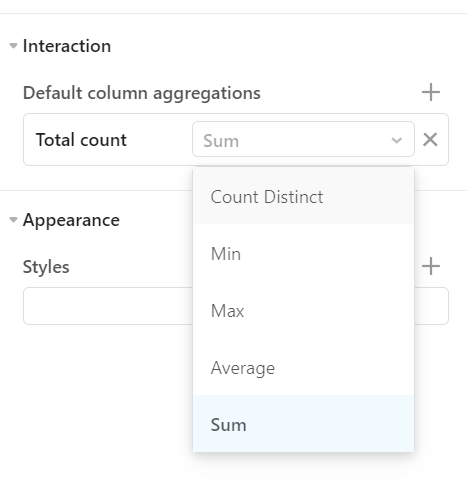
Add the option to create a custom aggregation through JavaScript to the summary row dropdown as shown in image.
looks like plotly added min/max and first/last aggregation functions within a day. otherwise plotly JS only uses JSON so unlikely. everything else i found uses dash
good request though regardless
Just want to cross-post these two other threads on related topic of additional aggregation functionality/controls for the table:
I have been working with group tables and found that the use of max and min in all column types would be helpful, and it works with any data type.
My use case needs to aggregate a Boolean column. In my case I need an "and" aggregation, which can be solved with a "min" aggregation (following the javascript standard: false=0, true=1), and a "max" could work as an "or".
Hey everyone,
I was surprised to see 4 different names that start with a "J"!
This has been requested in the past. I've logged this conversation to the ticket internally. Will check-in with any updates. I appreciate you all jumping in to collaborate!
+1
I need a custom aggregation for calculating a division between 2 aggregated row cells as opposed to an aggregation (average, sum, min, max, etc) that uses the values of the entire column.
+1 for custom aggregation (or even custom values from a separate subtotals/totals query) in grouped summary and table summary rows.
Thank you! I've logged these plus ones!
+1 for us too! Thanks!
Added to our feature request tracking. Thanks Alex!
Hey @AbbeyHernandez - Does this look like a feature that is going to added soonish? Or on the backburner?
No timeline on this just yet, but I will comment here if anything changes.
Thanks, @AbbeyHernandez .
For additional context, grouping rows is unusable when the table includes averages, as they need to be recomputed from the underlying data to provide an accurate number at a higher level. You can avoid this issue for the summary row at the bottom of a table by not defining a summary for columns that are averages, but it would at least be nice to have the summary excluded from the Grouped row within the table as well, since it just puts bad data into the table in the grouped row.
A quick fix (until what we describe above is available) would be to exclude column aggregations in grouped rows when no summary aggregation is specified for that column (it seems like the column aggregation just defaults to Sum right now anyway).
Thanks Drew! I shared this with our team. It helps to add more context on how this benefits our builders!
Thanks for sharing. It helps me a lot.
Wanted to add my ![]()
![]()
Our use case is the same as the boolean one described above. We have a big grid of checkboxes with grouped rows and want to show ![]() if all of the values in the grouping are true and
if all of the values in the grouping are true and ![]() if there is one or more false/null
if there is one or more false/null
Thanks for the +1! We're still tracking feedback, but currently, this request is in our backlog (not being prioritized over other work). If possible, I recommend a workaround in the meantime.
We'll follow up here if it gets reprioritized!