@mdsmith1 Hi! What's the issue?
Can you share a screenshot?
Hi @mdsmith1 Thanks for reaching out! That definitely sounds strange & is something we want to investigate asap ![]()
Agreed with @ScottR it would be helpful to see a screen share or screenshot. Is the component list not available or is it stuck in a loading state?
The new IDE did go live for all Cloud users this week, after being an optional beta feature for a while, so maybe that is related?
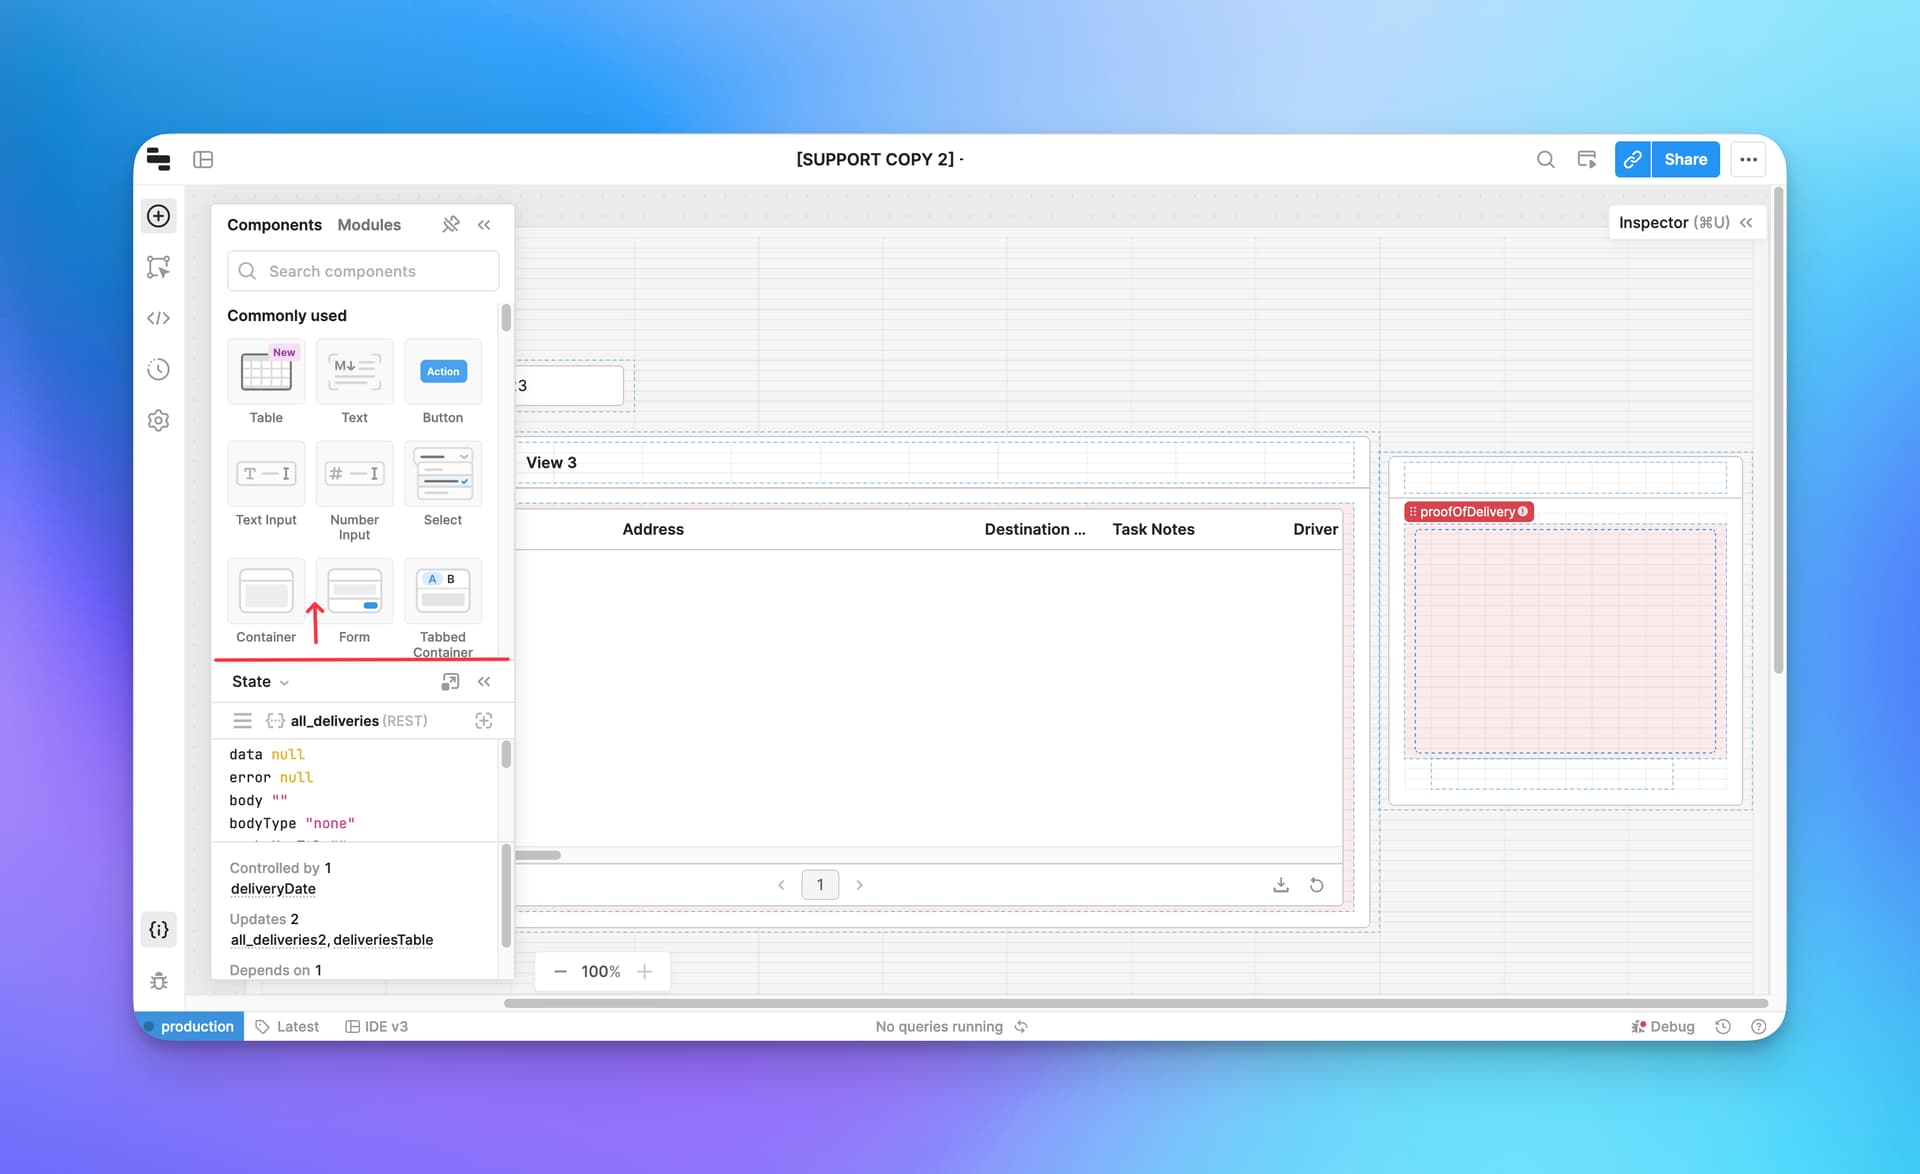
If so, you can add new components via the + button on the top left of the ide:

Tess:
OK, I have now figured out the Components Button.
What I don't comprehend is how these guys seem to be fixing things that aren't broken.
It now appears that we used to have the components on the right and now we have them on the left. Is that an improvement in someone's mind?
I now discover that I can't look at my existing code. I have attached a screen shot.

I can't find a way of opening up the code for "AwaitDeleteCompany".
I take it that you have done some Beta Testing on this thing. It seems that these changes are finally launched without any explanation to us developers. It would seem to be worthwhile to make these guys produce a paper outlining what they are doing and why is this deemed to be an improvement. It would then give us a place to comment back. We are the people who have to live with these things and we should have a voice.
Mike
Tess:
One other comment.
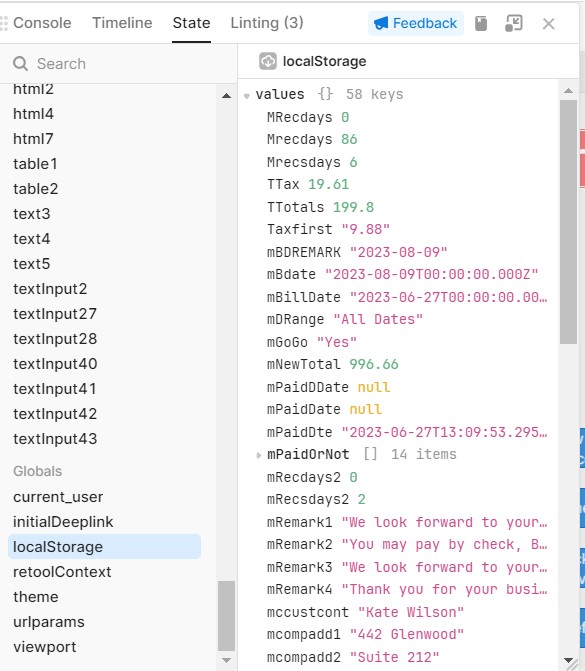
How do we "View State" like of we want to look at localStorage?
Mike
Hi @mdsmith1 Please don't hesitate to share any and all feedback about the IDE, and I'll make sure it gets to the right team members! We are still actively iterating on user feedback, and we certainly want to ensure it reflects what our users expect to see.
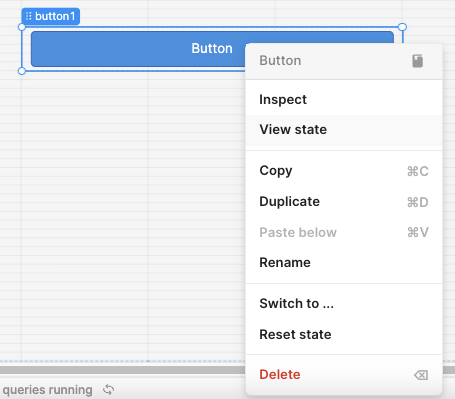
As far as the specific features that you mentioned, view state is on the bottom left panel:

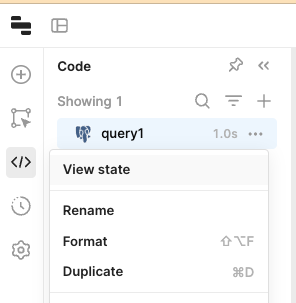
And you can view your code while editing the app or inspecting the components by clicking this code icon in the left panel:

If you prefer the old placement of the code editor, you can use this button on the top left corner to pin the code on the bottom:

For the components tab, I've shared your feedback internally. For context, the new IDE centralizes the most important app building features to a single place to make it easier to learn & easier to find everything, while also optimizing screen space. Additionally, the team was intentional about creating a flow from left to right so that you can drag your component onto the canvas and immediately jump into the inspector without having to switch tabs.
We have some information about the new IDE and other new features in this blog post, which links out to our Developer Day Youtube video. In the video, @jessicasun, shares a demo of the IDE and the thoughts behind the new IDE design. At a high level, the new IDE is more customizable, more user friendly on smaller screen sizes, and has a better code writing experience.
Now that the launch is official, we have some new IDE documentation that is coming out soon!
In addition to sharing feedback with us, you still have the opportunity to opt out of the IDE until August 23rd. If you do so, you'll be prompted to provide the team with your direct feedback
1 Like
Tess:
They have launched this thing without the documentation which apparently is coming soon. This reflects a serious failure in the management process. The documentation must come first, it should not be an after thought.
I have figured out out how to get at my code but I can't see how to view my local storage. This used to be under "State". How do I do this?
One other thing, I used to be able to navigate up and down the code list with the arrow keys, this is no longer possible. I think that feature should be restored. Arrow keys permit smoother navigation up and down the list.
Mike
1 Like
Like @Tess showed in the previous post What has happened to the development screens for Retool? - #7 by Tess
just click the hamburger (3 stacked lines) and select local storage. You can also access it from Debug section.
I don't agree with all the IDE changes, but you get used to it. If you take 5 minutes clicking around you'll find "the missing stuff" pretty easily and intuitively.
My screen does not have a hamburger (3 staked lines) but I do have a debug button and I was able to find local storage through there.
I agree that once we have habits of screen interactions there is a learning curve to deal with a different IDE. I accept that. But this seems to be change for the sake of change without any improvement in developer performance. We simply click differently and more often to get to the end points that we had before.
I think some burden of proof should be out on the people behind this to explain why they are doing this in the first place.
Mike
1 Like
Maybe they'll do a write-up about the IDE and that will suffice?
They certainly put more thought (and explanation) into their UI than most companies. Plus, they beta test with real customers (and you can actually be a part of it, not be schmuck # 129,383 on a waitlist). During the beta of Retool Database, they reached out for a 30-minute call to get my use case & feedback, so I know they're not just simply relying on usage analytics.
Do you like it?
Yes, I do in favor to the new IDE.
I appreciate the "tabbed" window structure for full-screen code and queries, especially on a laptop, as opposed to the old horizontal split that needed constant resizing. On a desktop with multiple monitors, I can then choose a view that's more productive.
Following a left-to-right flow makes sense: start with queries, code, or components, then arrange them on your canvas, and finally customize them.
One issue is that clicking the state icon includes components, forcing you to drag it up to see more state details, which I'd imagine is what most people want 99% of the time. See screenshot. @Tess
On the topic of viewing the state, there is an option when you right click to see the state. This is true for components and queries.
Yeah, no less than 3 ways to view state, which I can appreciate!
1 Like
What started this was viewing local storage which seems to go through convoluted navigation through the debugger.
I can't any other way of getting there. Someone thought it was under the "hamburger" but it is not on my screen.
Mike
Your localStorage value is stored in a component? You can right click on the component to view state
OR on left near bottom:
Scott:
I think there is a mixup about "State" and "Local Storage".
"State" happens to be the place where "Local Storage" was in the old IDE but not in this one.
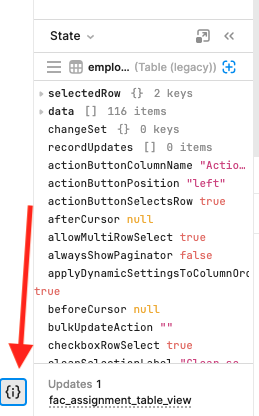
I am attaching a screen shot of my Local Storage found in the debugger. It is nothing to do with components. Its things about the profiles of customers and financial values associated with an invoice.
I am able to find this OK in the debugger but I find the navigation a little convoluted when it was so much easier in the old IDE.
Mike
That's fair....IMO I think the new IDE is definitely worth getting used to...
I can see my localStorage in an event handler in the component in my app using the left nav icon as I noted above
You know what I never want to have to do on a platform I build, deploy, and host business-critical tools on? Any of that.
1 Like