Is it possible to make an interactive GANTT Chart from a custom component?

I have a GANTT Chart in a custom component that I imported from GitHub - frappe/gantt: Open Source Javascript Gantt.

The imported chart looks like this:

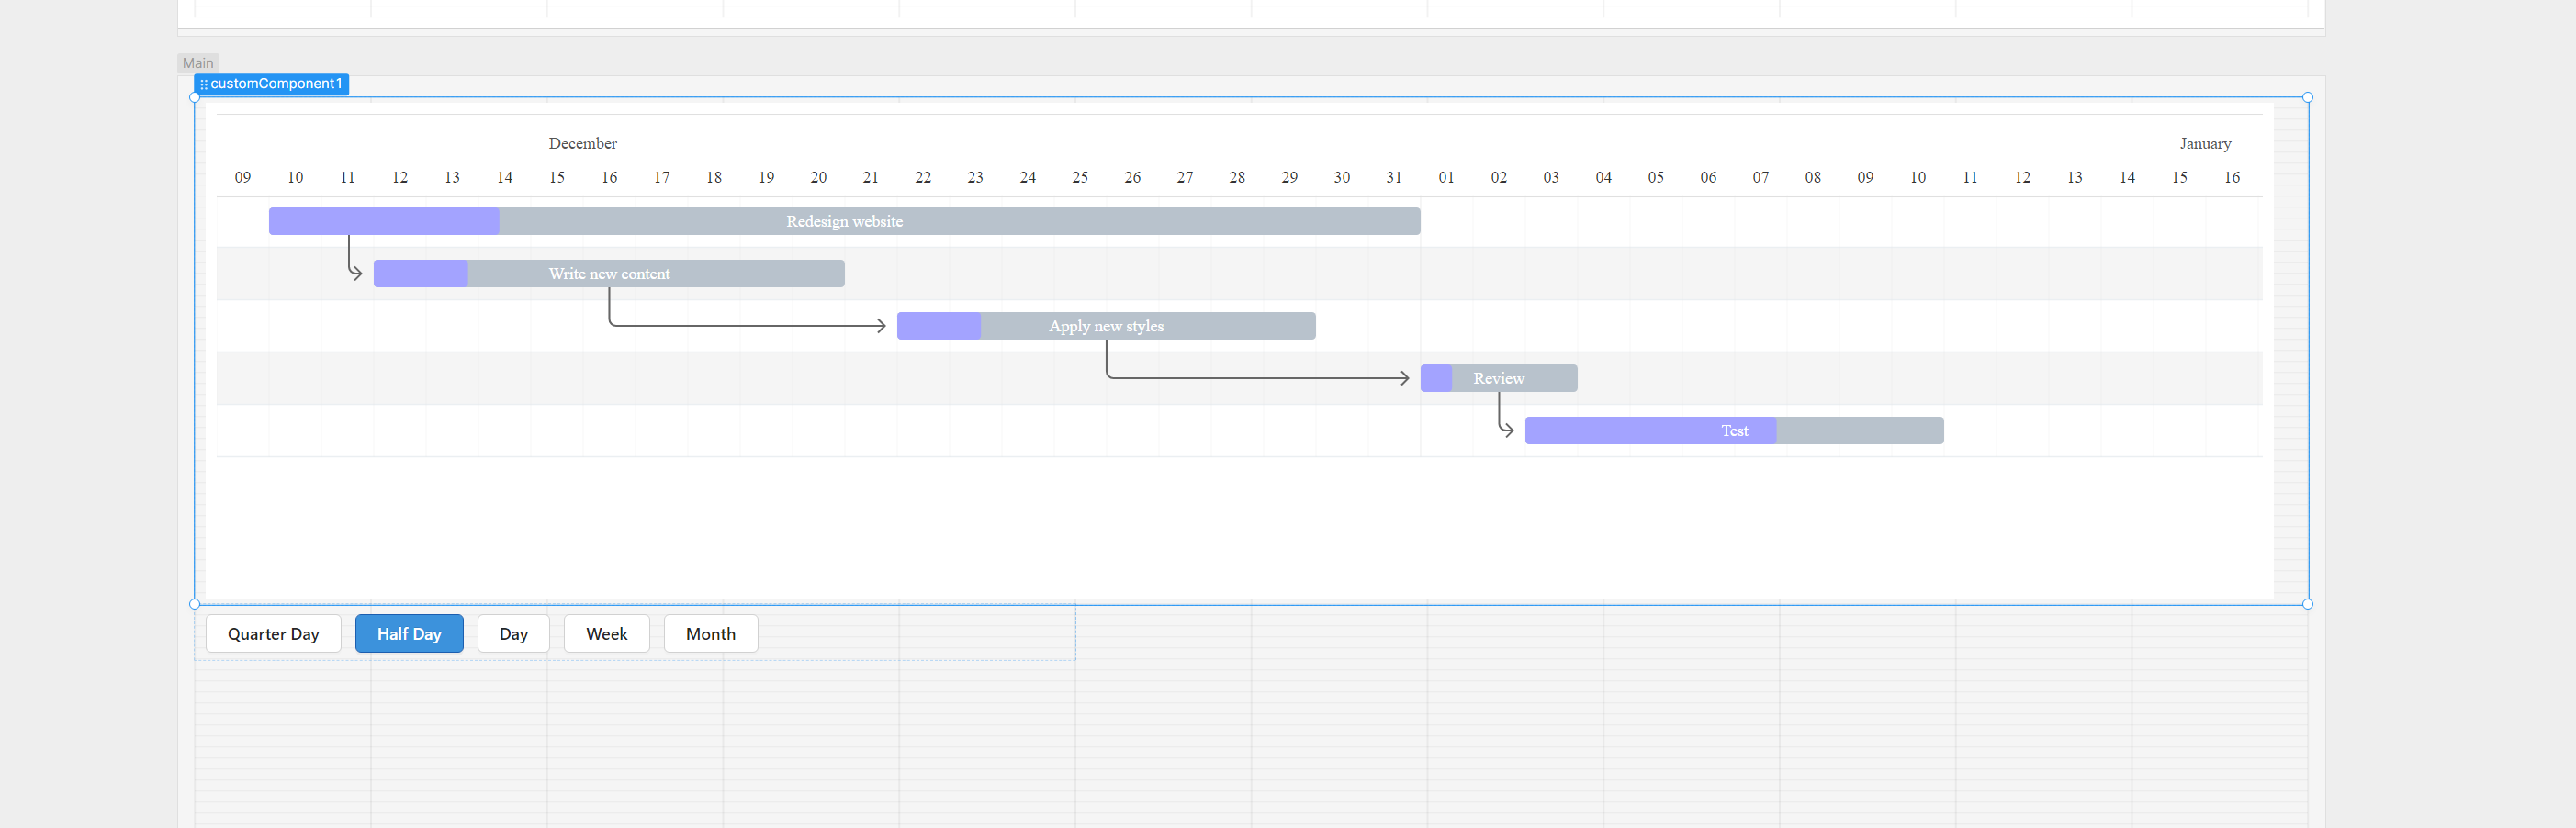
My goal is to add functionality to this chart to allow the user to enter new items or change the time frame, etc. I am confused how this is done. I have tried editing the block in the custom component but either I am doing it wrong, or it is not the right approach.

The iFrame code of the chart looks like this:

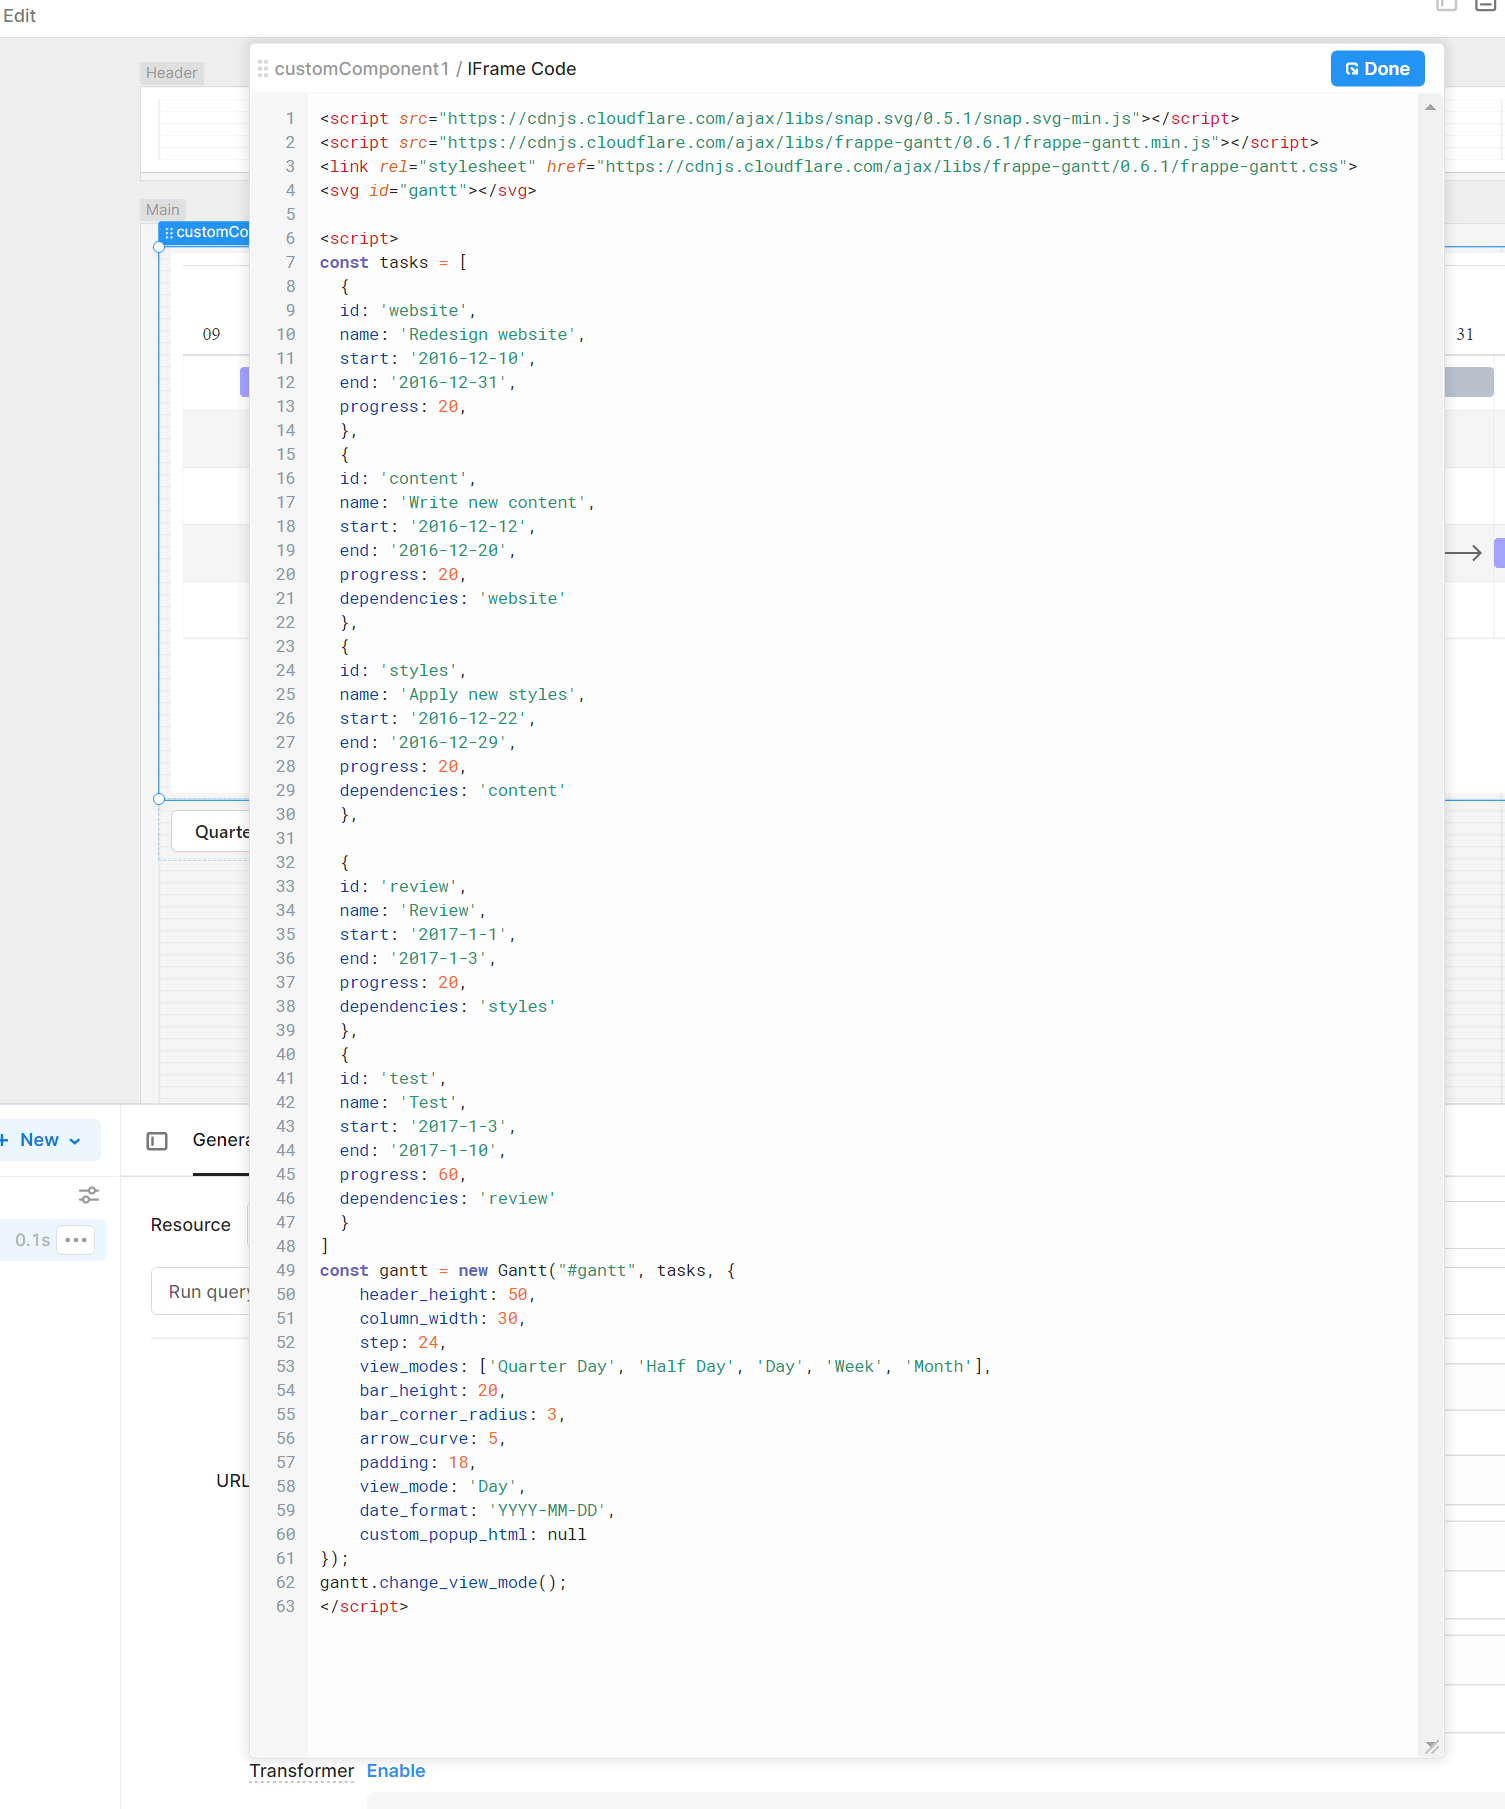
I notice that there seems to be JS linked from an external source at the top, I am curious if this source code is the only way to make this functional.

I appreciate any help. I am more so using this chart as an example for a bigger project.

Hey @David57940!

You can actually construct the entire tasks object within Retool and then pass it to the custom components model with something like:

{
 tasks: {{tasks.value}}
}

Where tasks is a transformer that actually builds the task array. You can then reference it in your custom component as follows (docs here):

<script src="https://cdnjs.cloudflare.com/ajax/libs/snap.svg/0.5.1/snap.svg-min.js"></script>
<script src="https://cdnjs.cloudflare.com/ajax/libs/frappe-gantt/0.6.1/frappe-gantt.min.js"></script>
<link rel="stylesheet" href="https://cdnjs.cloudflare.com/ajax/libs/frappe-gantt/0.6.1/frappe-gantt.css">
<svg id="gantt"></svg>

<script>
window.Retool.subscribe(model => new Gantt("#gantt", model.tasks, {
    header_height: 50,
    column_width: 30,
    step: 24,
    view_modes: ['Quarter Day', 'Half Day', 'Day', 'Week', 'Month'],
    bar_height: 20,
    bar_corner_radius: 3,
    arrow_curve: 5,
    padding: 18,
    view_mode: 'Day',
    date_format: 'YYYY-MM-DD',
    custom_popup_html: null
  })
);
</script>

How to design the UI to build that task data is then up to you! You might, for instance, try having a table with a column for each task property along with a project id and then manipulating that data using Retool's normal flows for reading/writing to databases.

Let me know what additional questions that raises!

2 Likes

Thank you!

Thanks so much for responding to this.

I'm working on a similar project using a postgreSQL backend. I want to see a gantt chart for each project I have in the database, instead of hardcoding them in the task array. From what I am seeing, you have to create a new array for each project, but I want to do this automatically.

Here's an example:

const tasks = [
{
id: 1,
name: 'randomProjectName,
start: '2022-12-10',
end: '2022-12-31',
progress: 20,
}, .....

if I have 10 projects, I'd like to see 10 arrays with each element mapped to the proper column in my database. Whenever I add a new project (through a form or w/e), I want that to automatically add a new record, too.

any suggestions?
Thanks!

Hey @atobitt!

Is your idea to show those charts simultaneously or be able to switch between them?

Since you're passing the task list to your custom component via the component's model you can construct the array however you'd like within your app. For instance, you could write a JS query and pass the following to your model:

{
tasks: {{yourJsQuery.data}}
}

The same could be done by adding a transformer to your PostgreSQL query and passing that data in, etc.

Dynamically generating multiple charts is a bit trickier as you'd need to create separate HTML elements for each chart. Say you pass in an array of tasks lists instead you can try using the following as a basis for doing so:

<script src="https://cdnjs.cloudflare.com/ajax/libs/snap.svg/0.5.1/snap.svg-min.js"></script>
<script src="https://cdnjs.cloudflare.com/ajax/libs/frappe-gantt/0.6.1/frappe-gantt.min.js"></script>
<link rel="stylesheet" href="https://cdnjs.cloudflare.com/ajax/libs/frappe-gantt/0.6.1/frappe-gantt.css">

<div id="charts-container" />

<script>
window.Retool.subscribe((model) => {
  const charts = document.getElementById("charts-container");

  for (let i in model.tasks) {
    const taskList = model.tasks[i];
    const chartContainer = document.createElement("svg");
    
    charts.appendChild(chartContainer);

    new Gantt(chartContainer, taskList, {
      header_height: 50,
      column_width: 30,
      step: 24,
      view_modes: ["Quarter Day", "Half Day", "Day", "Week", "Month"],
      bar_height: 20,
      bar_corner_radius: 3,
      arrow_curve: 5,
      padding: 18,
      view_mode: "Day",
      date_format: "YYYY-MM-DD",
      custom_popup_html: null,
    });
  }
});
</script>

Let me know if that helps!

1 Like