Hello,
I'm new to retool (loving it so far) but have come across an issue i've spent ages trying to solve while creating a mobile app
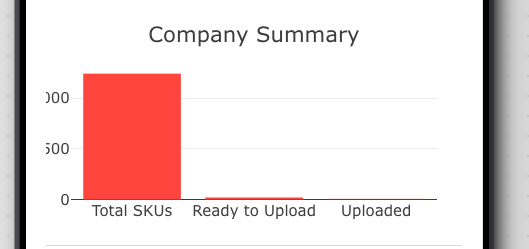
. When I set up a bar chart I'm losing visibility of part of the y axis.. so you can't see all the numbers.
I've read around and tried to replicate some of the coding (i'm fairly new to that too) suggestions but nothing seems to work. The Plotly Data I've used and a screenshot are below
{
type: 'bar',
x: ['Total SKUs', 'Ready to Upload', 'Uploaded'],
y: [1242, 20, 5],
marker: { color: 'rgb(247,79,65)' },
},
]
Any help much appreciated!