Hey @perceptron!
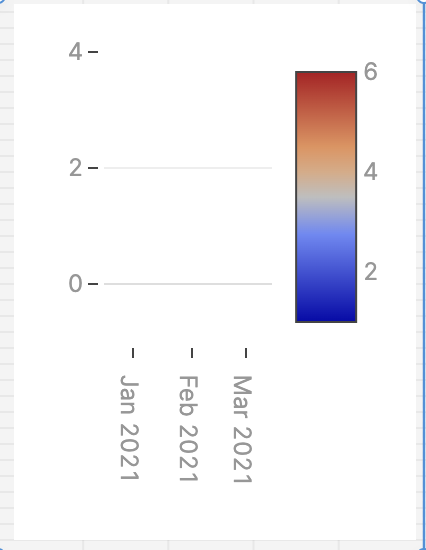
This heatmap issue is actually due to the default layout settings. Here the Y-Axis is set to Linear, You'll want to get rid of this or change it to something more fitting for your data set like Category.
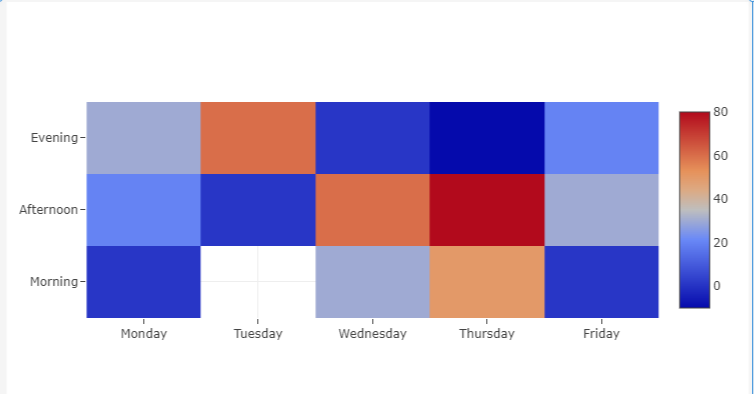
Here is my Data tab:
 [
  {
    z: [[1, null, 30, 50, 1], [20, 1, 60, 80, 30], [30, 60, 1, -10, 20]],
    x: ['Monday', 'Tuesday', 'Wednesday', 'Thursday', 'Friday'],
    y: ['Morning', 'Afternoon', 'Evening'],
    type: 'heatmap',
    hoverongaps: false
  }
]
Here is my layout Tab:
{
  "title": {
    "text": "",
    "font": {
      "color": "#3D3D3D",
      "size": 16
    }
  },
  "font": {
    "family": "Inter",
    "color": "#979797"
  },
  "showlegend": true,
  "legend": {
    "xanchor": "center",
    "x": 0.45,
    "y": -0.2,
    "orientation": "h"
  },
  "margin": {
    "l": 16,
    "r": 24,
    "t": 24,
    "b": 32,
    "pad": 2
  },
  "hovermode": "closest",
  "hoverlabel": {
    "bgcolor": "#000",
    "bordercolor": "#000",
    "font": {
      "color": "#fff",
      "family": "Inter",
      "size": 12
    }
  },
  "clickmode": "select+event",
  "dragmode": "select",
  "xaxis": {
    "title": {
      "text": "",
      "standoff": 6,
      "font": {
        "size": 12
      }
    },
    "type": "-",
    "tickformat": "",
    "automargin": true,
    "fixedrange": true,
    "gridcolor": "#fff",
    "zerolinecolor": "#fff"
  },
  "yaxis": {
    "title": {
      "text": "",
      "standoff": 6,
      "font": {
        "size": 12
      }
    },
    "type": category,
    "tickformat": "",
    "automargin": true,
    "fixedrange": true,
    "zerolinecolor": "#DEDEDE"
  }
}
.Hope That helps! Love that you are using heat maps in Retool! Super cool idea