Hello,
I have a question about how the timeline component interacts with dates. I'm trying to show a gantt chart indicating when staff are onsite. I have two fields for each staff member, the onsite start date and onsite last date.
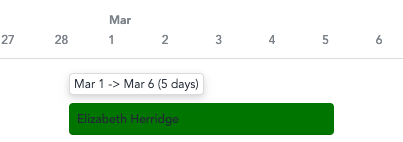
As you can see from the screen shot, the timeline component displays this as 5 days, but that staff member is actually onsite for 6 days (1st March - 6th March inclusive). Is there a way to change how the timeline component displays this data? I don't want to transform the data to fudge it to work, as that will likely cause confusion elsewhere.
Assistance appreciated!
Many thanks in advance