I am of the opinion that
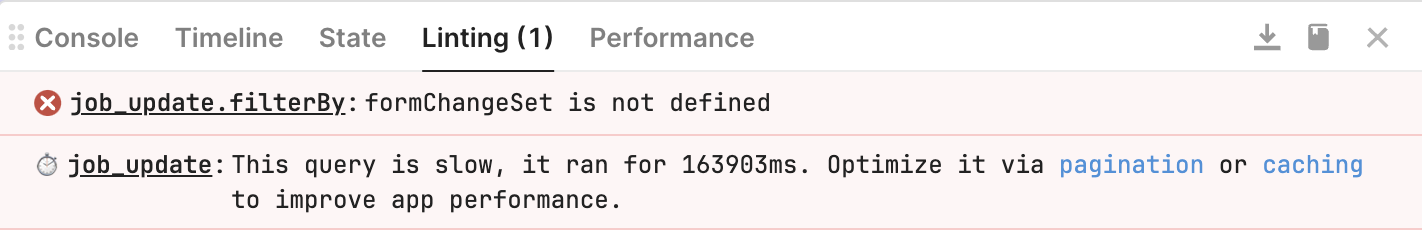
This query is slow, it ran for nnn ms. Optimize it via pagination or caching to improve performance
is either a bug or a confusion in definition.
If you watch the linter, you can see the number of ms increase each time you run a particular query. So if you call customer_update.trigger() many times over the course of a day, you will get a very scary number.
ie this is a cumulative total, not the actual speed of a single call to the query.
I don't know if this is on purpose to help people spot queries that are using a lot of cumulative time, but if so then the language is very misleading. It would be more appropriate to say something like
This query is using a lot of time. It ran 127 times in the last 24 hours, for a total of 163903ms. Optimize it by reducing the number of times it runs or via pagination or caching.
I'd be interested to know if this is an actual thing and if so can I ignore it. Or ask Retool to fix it.
With thanks,