Use Retool's Table as a Heatmap
tl;dr
Find the column's Min and Max values for use in a calculation in hsl().
i.e. Use a Query, Transformer, or Variable called minMaxValues :
hsl({{((item - minMaxValues.value.result_a_min) / (minMaxValues.value.result_a_max - minMaxValues.value.result_a_min)) * 120}} 100% 65%)
See w3schools hsl
How it works
Retool Table cells can be formatted with the Table's Column’s "Background color" attribute.
Retool Table gives access to {{ item }} and/or {{ currentSourceRow }} in order to make calculations in the Background color attribute for a row of a column of data.
There are two main ways to set the color of a cell:
- Chain ternaries to get color steps (i.e. Red, Yellow, Green)
- Normalize the color, i.e. calculate a color based on a range i.e. using HTML's
hsl()function to go fromhsl(0 100% 65%)throughhsl(120 100% 65%). All that's needed is a percentage value to calculate a color within the 0 to 120 range i.e.hsl(0.5*120 100% 65%)
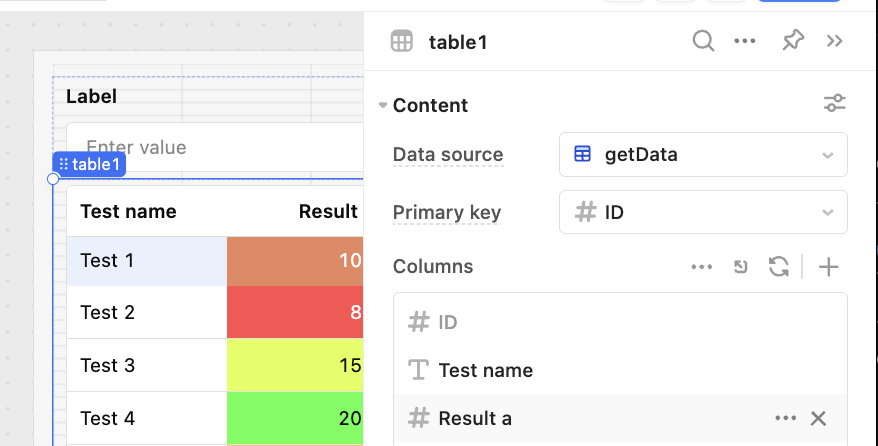
Here's steps to set the Background color on a Retool Table:
Select your Table on the App Canvas ->
View the Inspector ->
Select a column ->
Update the Background color field.
To find the "Background" attribute
Color the quick way: Color steps with the ternary operator
If you know the boundaries for stepping to a different color, it's easiest to use a ternary.
Screenshot of Ternary color table:

Column Background
-
Reminder how Retool works: The notation
{{ }}with curly brackets is used in Retool to escape from inputting text and start writing javascript that has access to the current state. -
Reminder about how ternary works:
{{ isCorrect ? 'green' : 'red' }} -
Example where
{{ item }}is a reference to the current Row, and{{ item.days_since_last_save }}is a number of days since some update:
{{ item.days_since_last_save.len === 0 ? 'default' : item.days_since_last_save < 30 ? '#b6d7a8' : currentRow.days_since_last_save < 90 ? '#d9ead3' : currentRow.days_since_last_save >= 365 ? '#fff2cc' : 'default'}} -
Pseudocode for that example:
if there's no data
  ‘default’
else if <30 days = ‘#b6d7a8’
else if <90 days = ‘#d9ead3’
else if <365 days = ‘#fff2cc’
else ‘default’
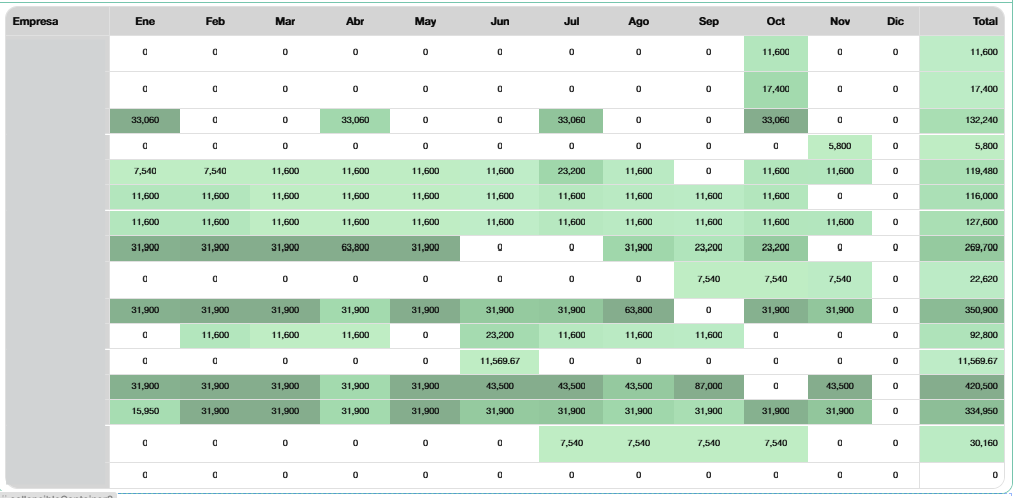
2.1 Heatmap colors attempt 1: row-based approach to finding min and max
Apps can find the minimum and maximum for a range of data. Once the min and max are known, we can use those values to normalize the cell color, or figure out the percentage position along a range. This is useful in visual data analysis across many columns at the same time.


V1 - Starting from a Table of data
As an un-optimized example first, because let's say you start by wanting to iterate a Table to find the mins and maxes.
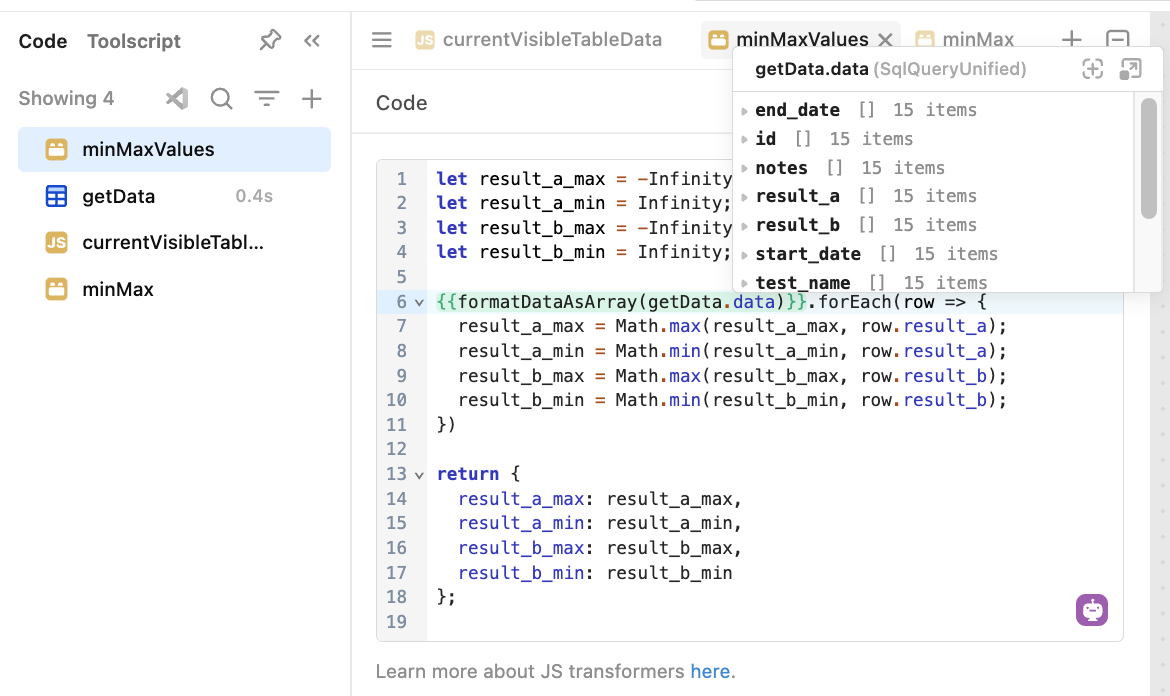
This code could be placed in a Transformer called minMaxValues and it uses a Row-based approach to finding the Min/Max. Below is a faster column-based approach.
let result_a_max = -Infinity;
let result_a_min = Infinity;
let result_b_max = -Infinity;
let result_b_min = Infinity;

{{table1.data}}.forEach(row => {
// Calculate the Max and Min for every range needed

// Result_A
result_a_max = Math.max(result_a_max, row.result_a);
result_a_min = Math.min(result_a_min, row.result_a);

// Result_B
result_b_max = Math.max(result_b_max, row.result_b);
result_b_min = Math.min(result_b_min, row.result_b);
})

return {
result_a_max: result_a_max,
result_a_min: result_a_min,
result_b_max: result_b_max,
result_b_min: result_b_min
};
Note: I started with this because sometimes you'll start from a Table and be thinking in Rows. There's a helper function to convert columnar data into row-based data with
2.2 Heatmap calculation optimized for Columns of data
Often data is already given as column data in query.data and finding the min and max of an array in Javascript is Math.min({{getdata.data.array}})
Screenshot: hovered over getData.data to find that we already have columns available.
formatDataAsArray() to keep using row-based approaches.
V2 - Final version. Don't build your own columns.
The minMaxValues code (Transformer or JS Query) is just this for my two columns:
return {
  result_a_max: Math.max({{getData.data.result_a}}),
  result_a_min: Math.min({{getData.data.result_a}}),

  result_b_max: Math.max({{getData.data.result_b}}),
  result_b_min: Math.min({{getData.data.result_b}})
};
Reference the value {{ minMaxValues.result_a_max }} and {{ minMaxValues.result_a_max }} and {{item}} or {{currentSourceRow}} on Retool Table's configuration to calculate each cell value's position in the min/max range.
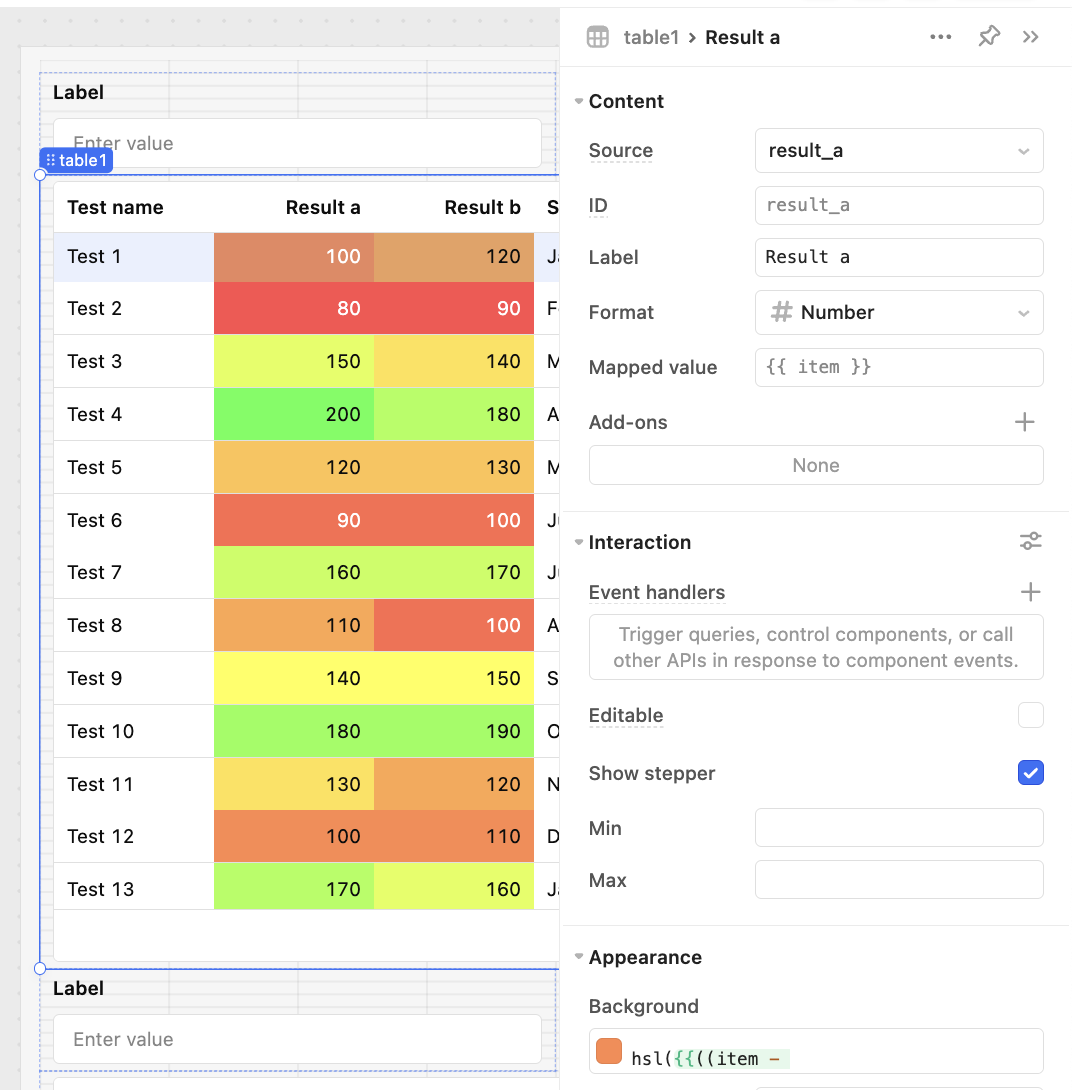
Pick a color
For the column's Background attribute: hsl({{((item - minMaxValues.value.result_a_min) / (minMaxValues.value.result_a_max - minMaxValues.value.result_a_min)) * 120}} 100% 65%)
Hue is computed in HSL(Hue Saturation Lightness) where Hue is ((value - min) / (max - min)) * upperThreshold, or "{{item}}'s value's percentage within the range of colors from 0 to upperThreshold"
W3 Colors HSL: Colors HSL and HSLA
Sidenote: Mins and Maxes via SQL
The minimum and maximum values of table data can be found with SQLSelect in a Database Query i.e. SELECT MIN(result_a), MAX(result_a) FROM your_table;
Use Retool Table
If you don't have access to {{item}} or {{current_row}} inside the Column's settings then upgrade your instance and use the new components!
Quick how-to
To set Cell colors, click on your table and then select the Column you want to use
Screenshot: Here's my "Result a" column selected on a Table:
Visible values
Tables can have a Fuzzy Match Search that changes what’s "visible" in the table.
Screenshot: Fuzzy search with a text input:

A Javascript Query i.e. currentVisibleTableData can run this code to retrieve the live Table data: return table1.getDisplayedData() and Javascript Queries must be triggered by some event in Retool.
Transformers then reference the output of the Javascript Query currentVisibleTableData.
When the Fuzzy Filter's value changes the event handler can trigger the JS Query currentVisibleTableData to run the getDisplayedData function and update its state.
Fast UI
Depending on your call-chain the Transformer may run faster than table1.getDisplayedData() and cause a UI mismatch. Might be resolved in the future.
i.e.

Add a debounce on the change event to reduce mis-coloring the rows with old data while typing.
Screenshot: Change event on the Text Input that's connected as a Fuzzy Match filter on the Table: