Fun and goood prompts
I wanted to create two prompts that were not only functional but also fun. I aimed for prompts that make Assist smile before it gets to work and produces high-quality output. The idea came from a small moment earlier today. I saw a barista dancing behind the counter while making coffee, as if the fate of the galaxy depended on his foam art. That energy inspired the structure.
I thought: What if prompts could start off funny but finish with great organization and professionalism? That’s how the first prompt was born: a dashboard created with the desperation of an employee trying to win a company-paid trip to Tokyo.
Assist, build this dashboard with the same determination as an office worker who just
found out that the CEO is reviewing the quarterly results personally — and whoever makes
the cleanest, sharpest dashboard gets an all-expenses-paid vacation to Tokyo.
He designs it so flawlessly that the CEO pauses, removes his glasses, and whispers:
“This… this is promotion material.”
Bring that level of excellence here.
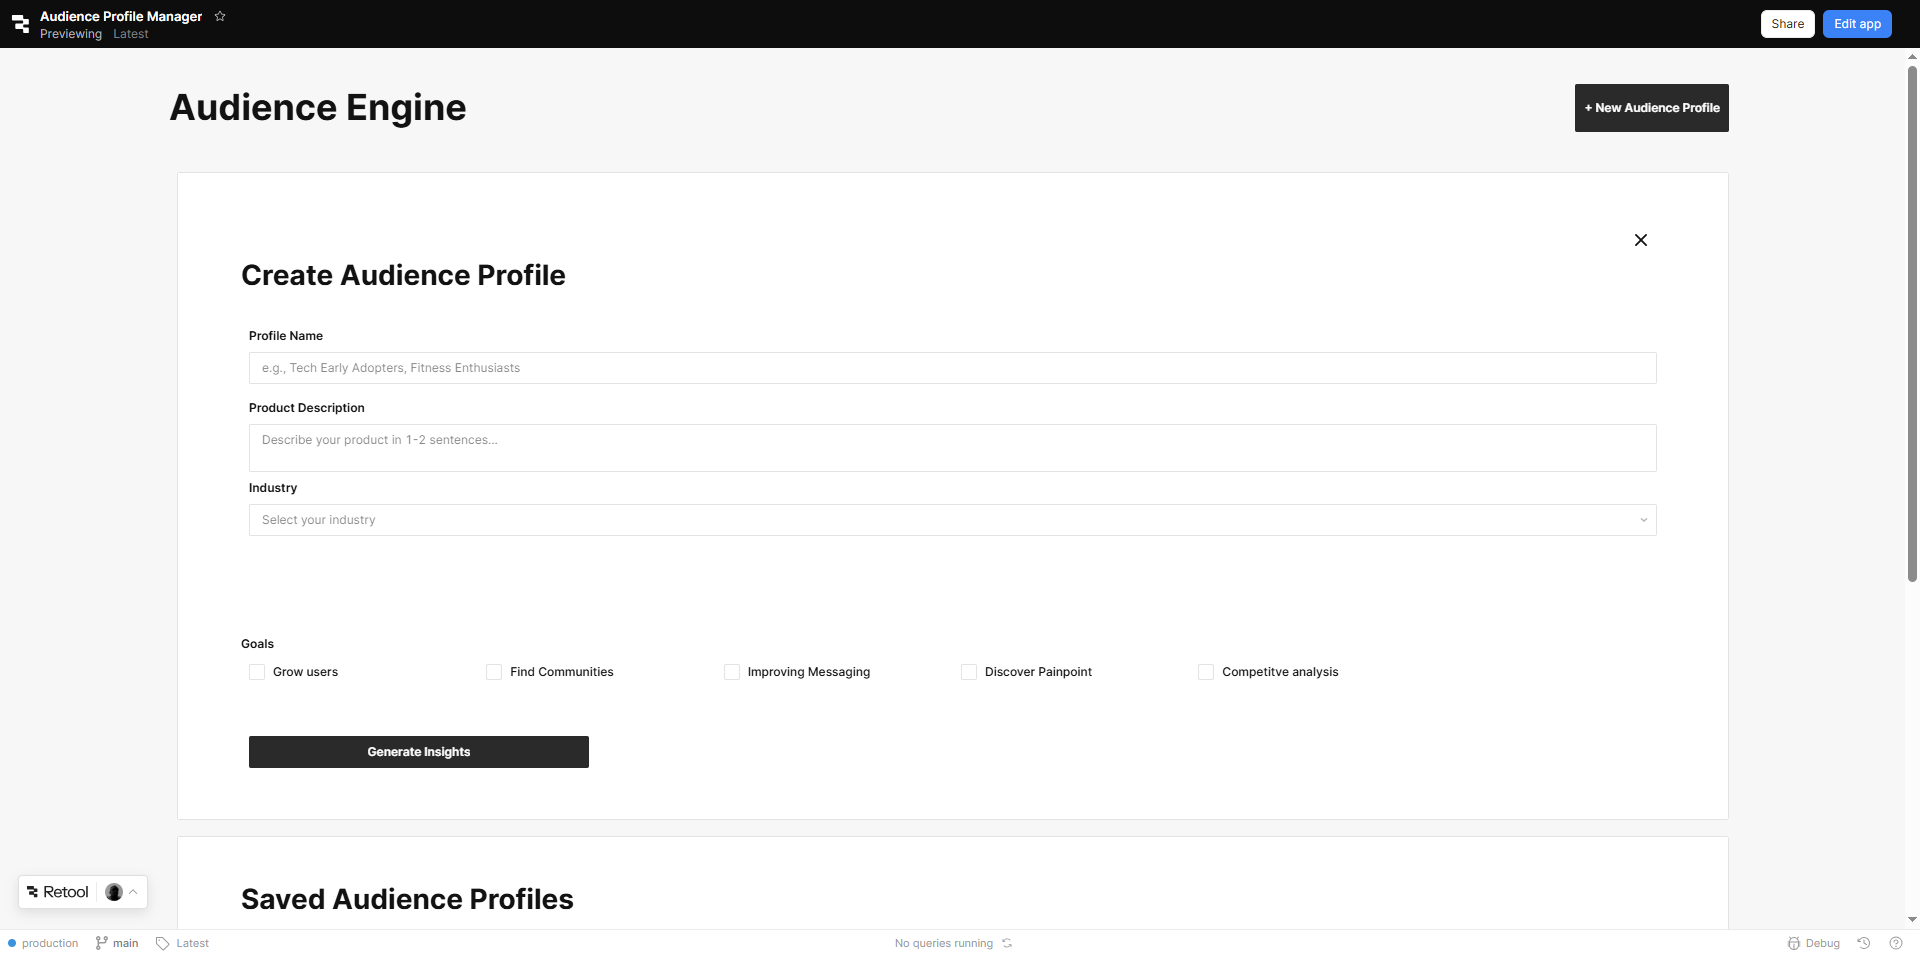
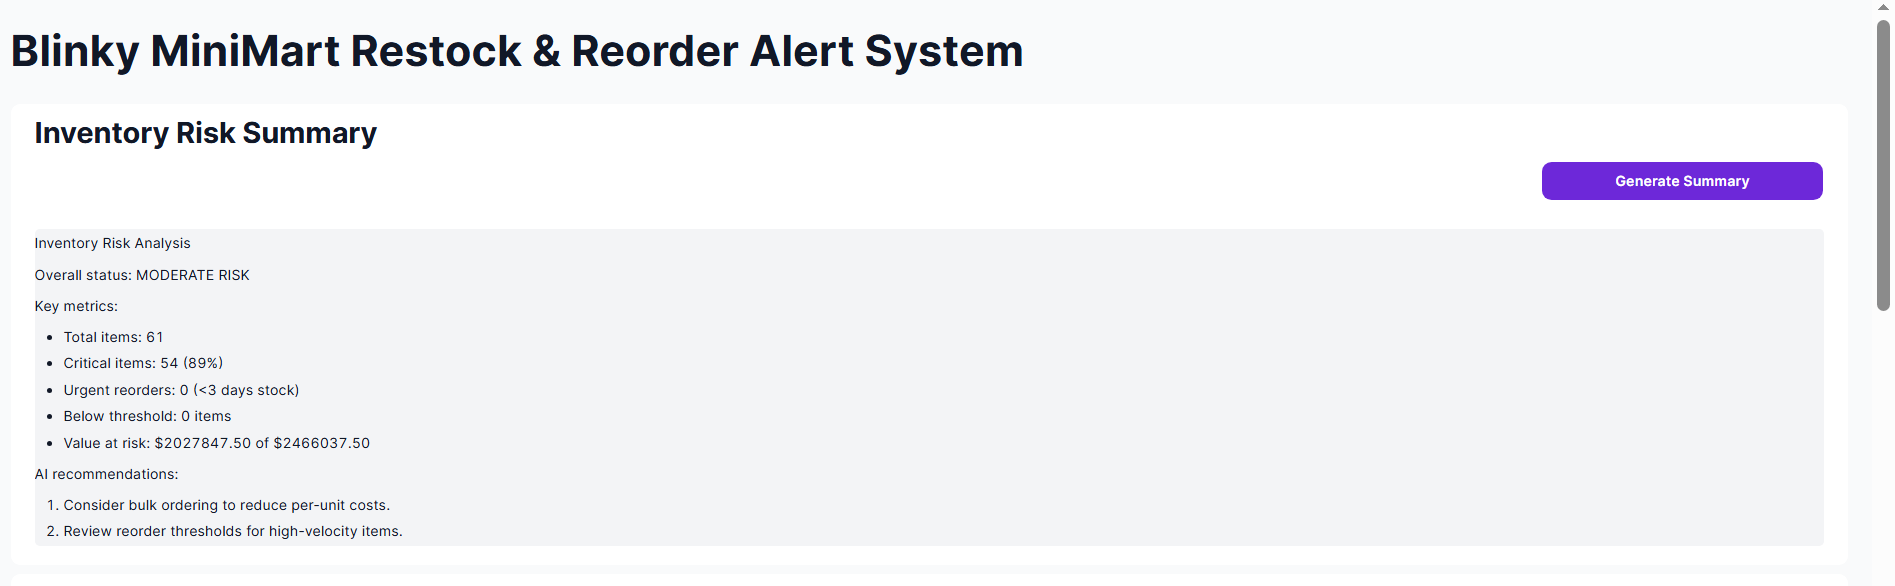
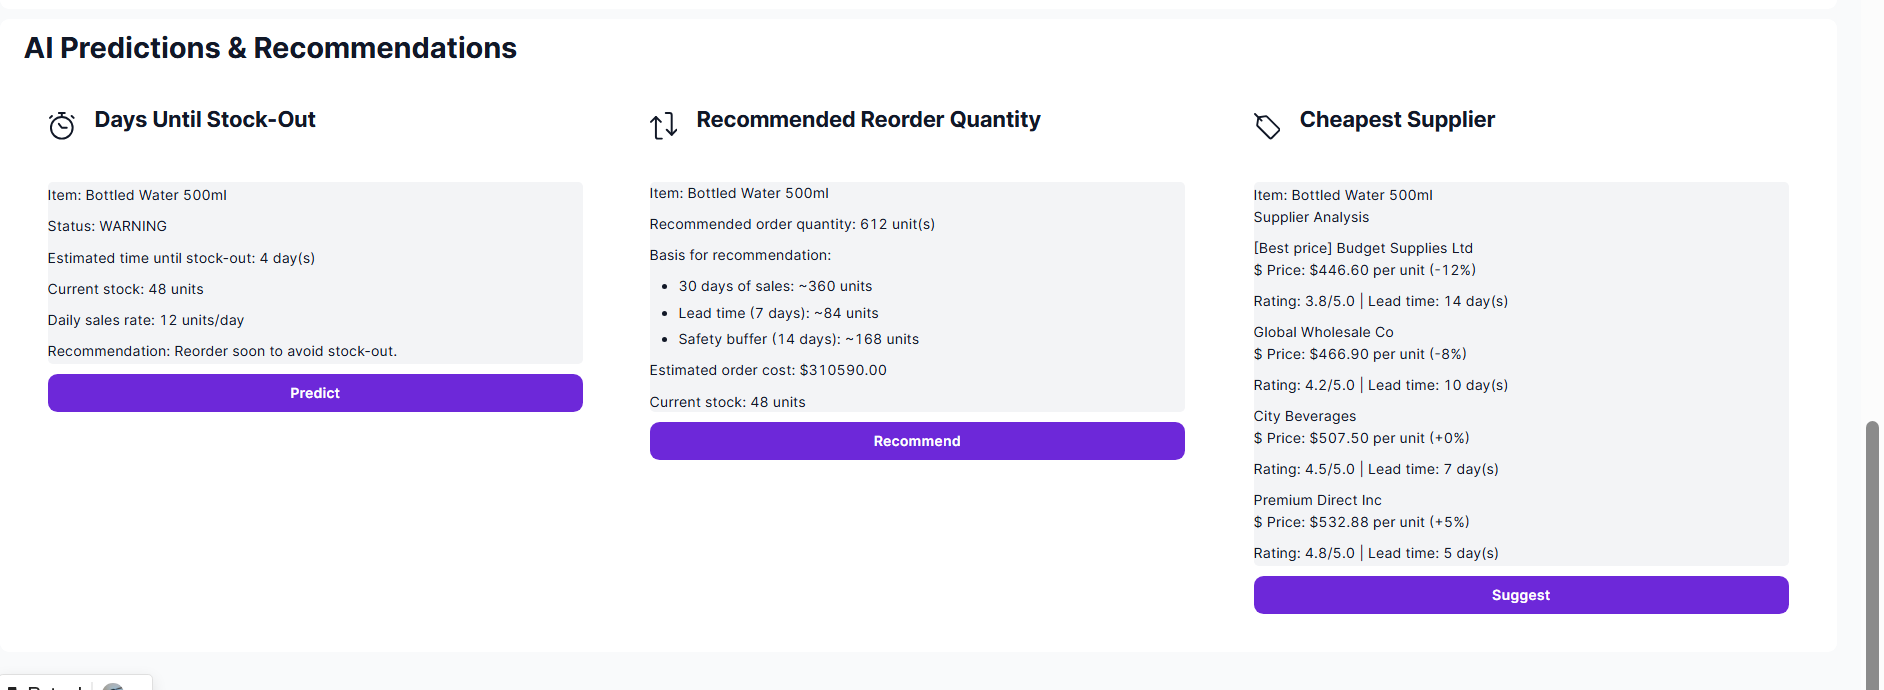
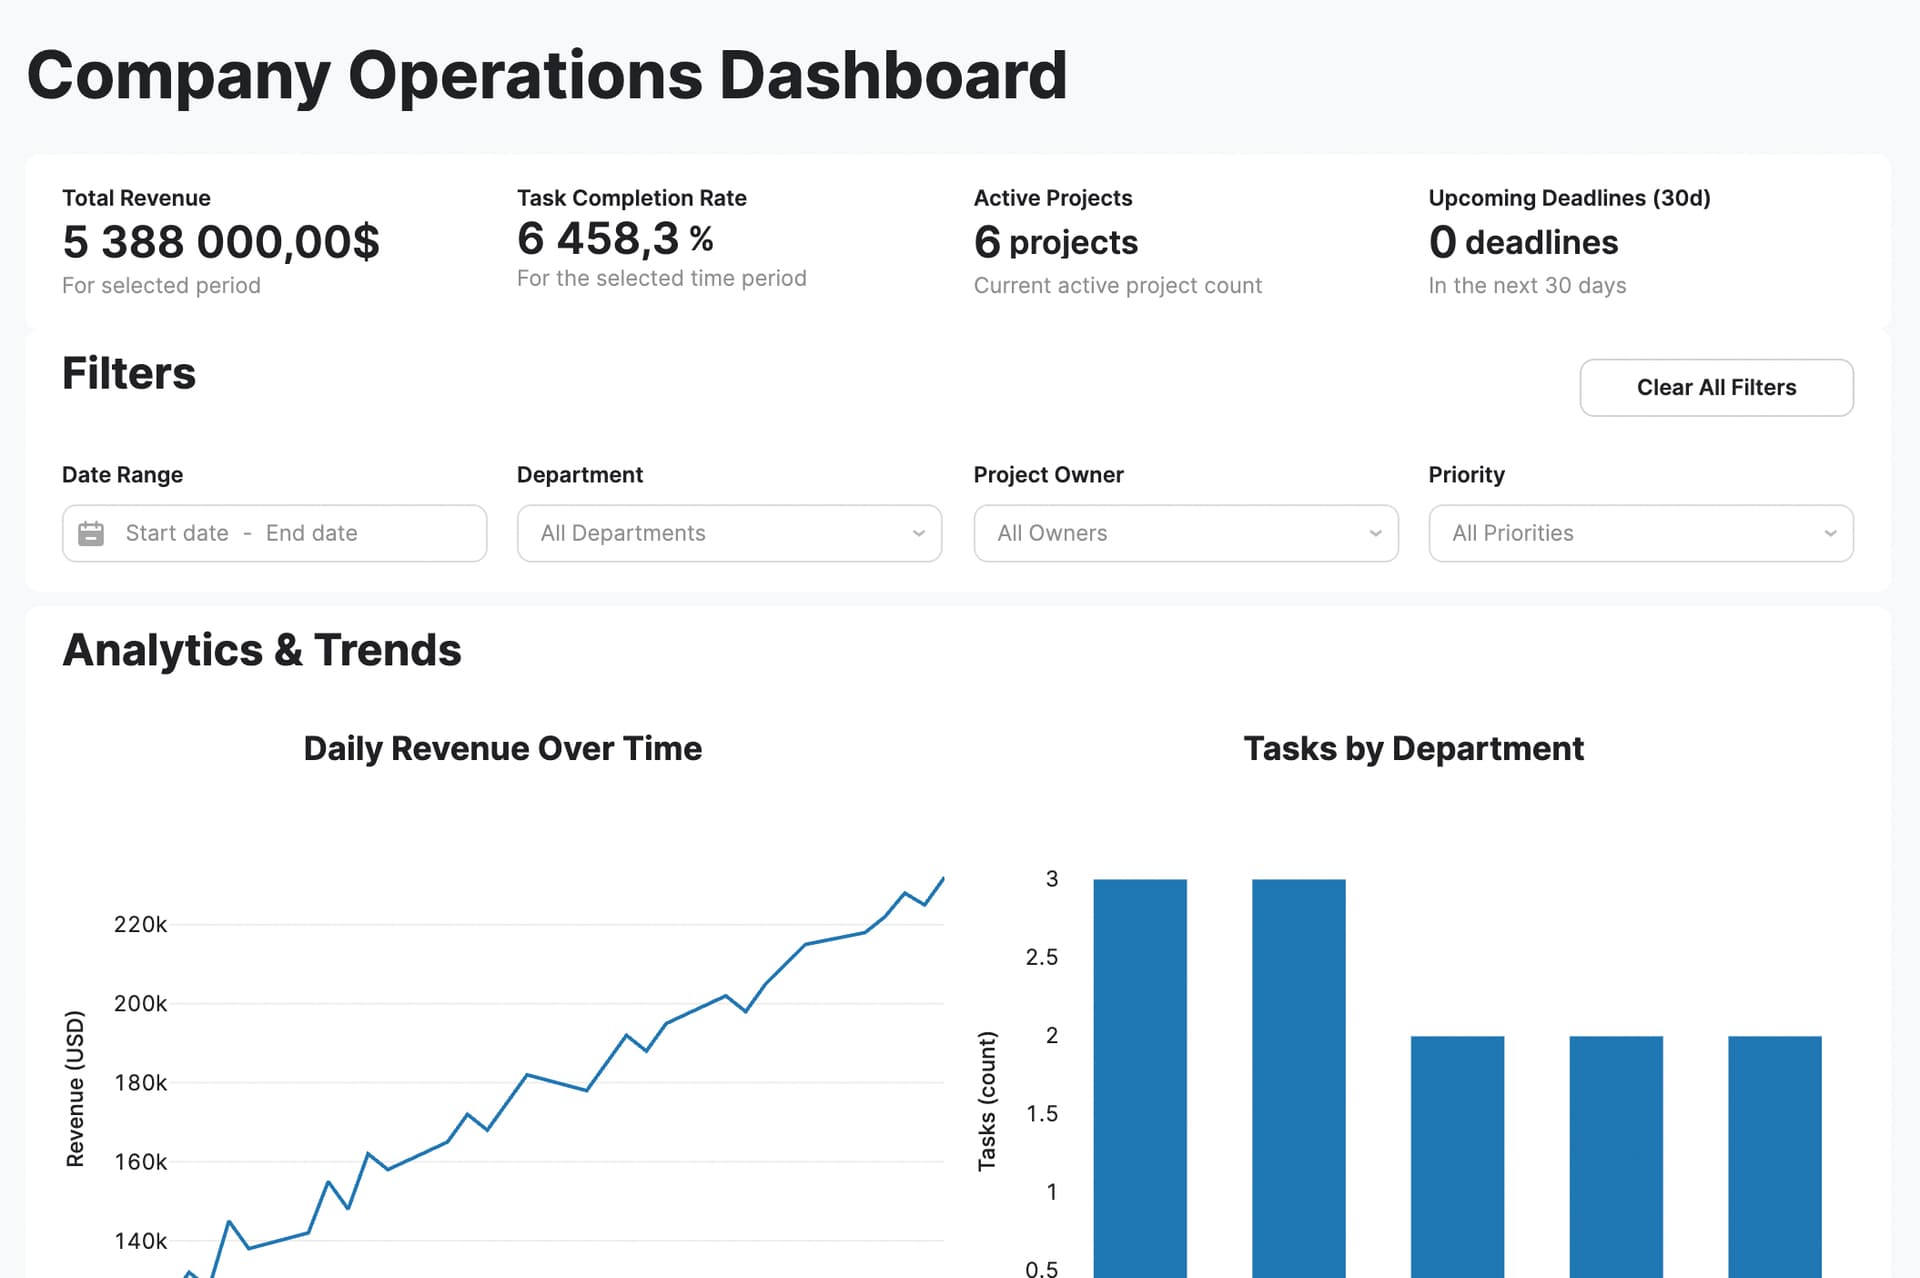
Create a professional internal dashboard for company employees:
- Include KPI cards for revenue, task completion rate, active projects, and deadlines.
- Add interactive charts (line, bar, and pie) that update when filters are changed.
- Include filters for date range, department, project owner, and priority.
- Add a table of ongoing tasks with sorting, search, and row-click expansion.
- Make the layout clean, readable, and corporate-grade: balanced spacing, strong visual hierarchy.
- Ensure performance is smooth, logical, and organized for a real internal tool.
Funny intro aside, the objective is to produce a high-quality, reliable dashboard
for daily operational use across the company.
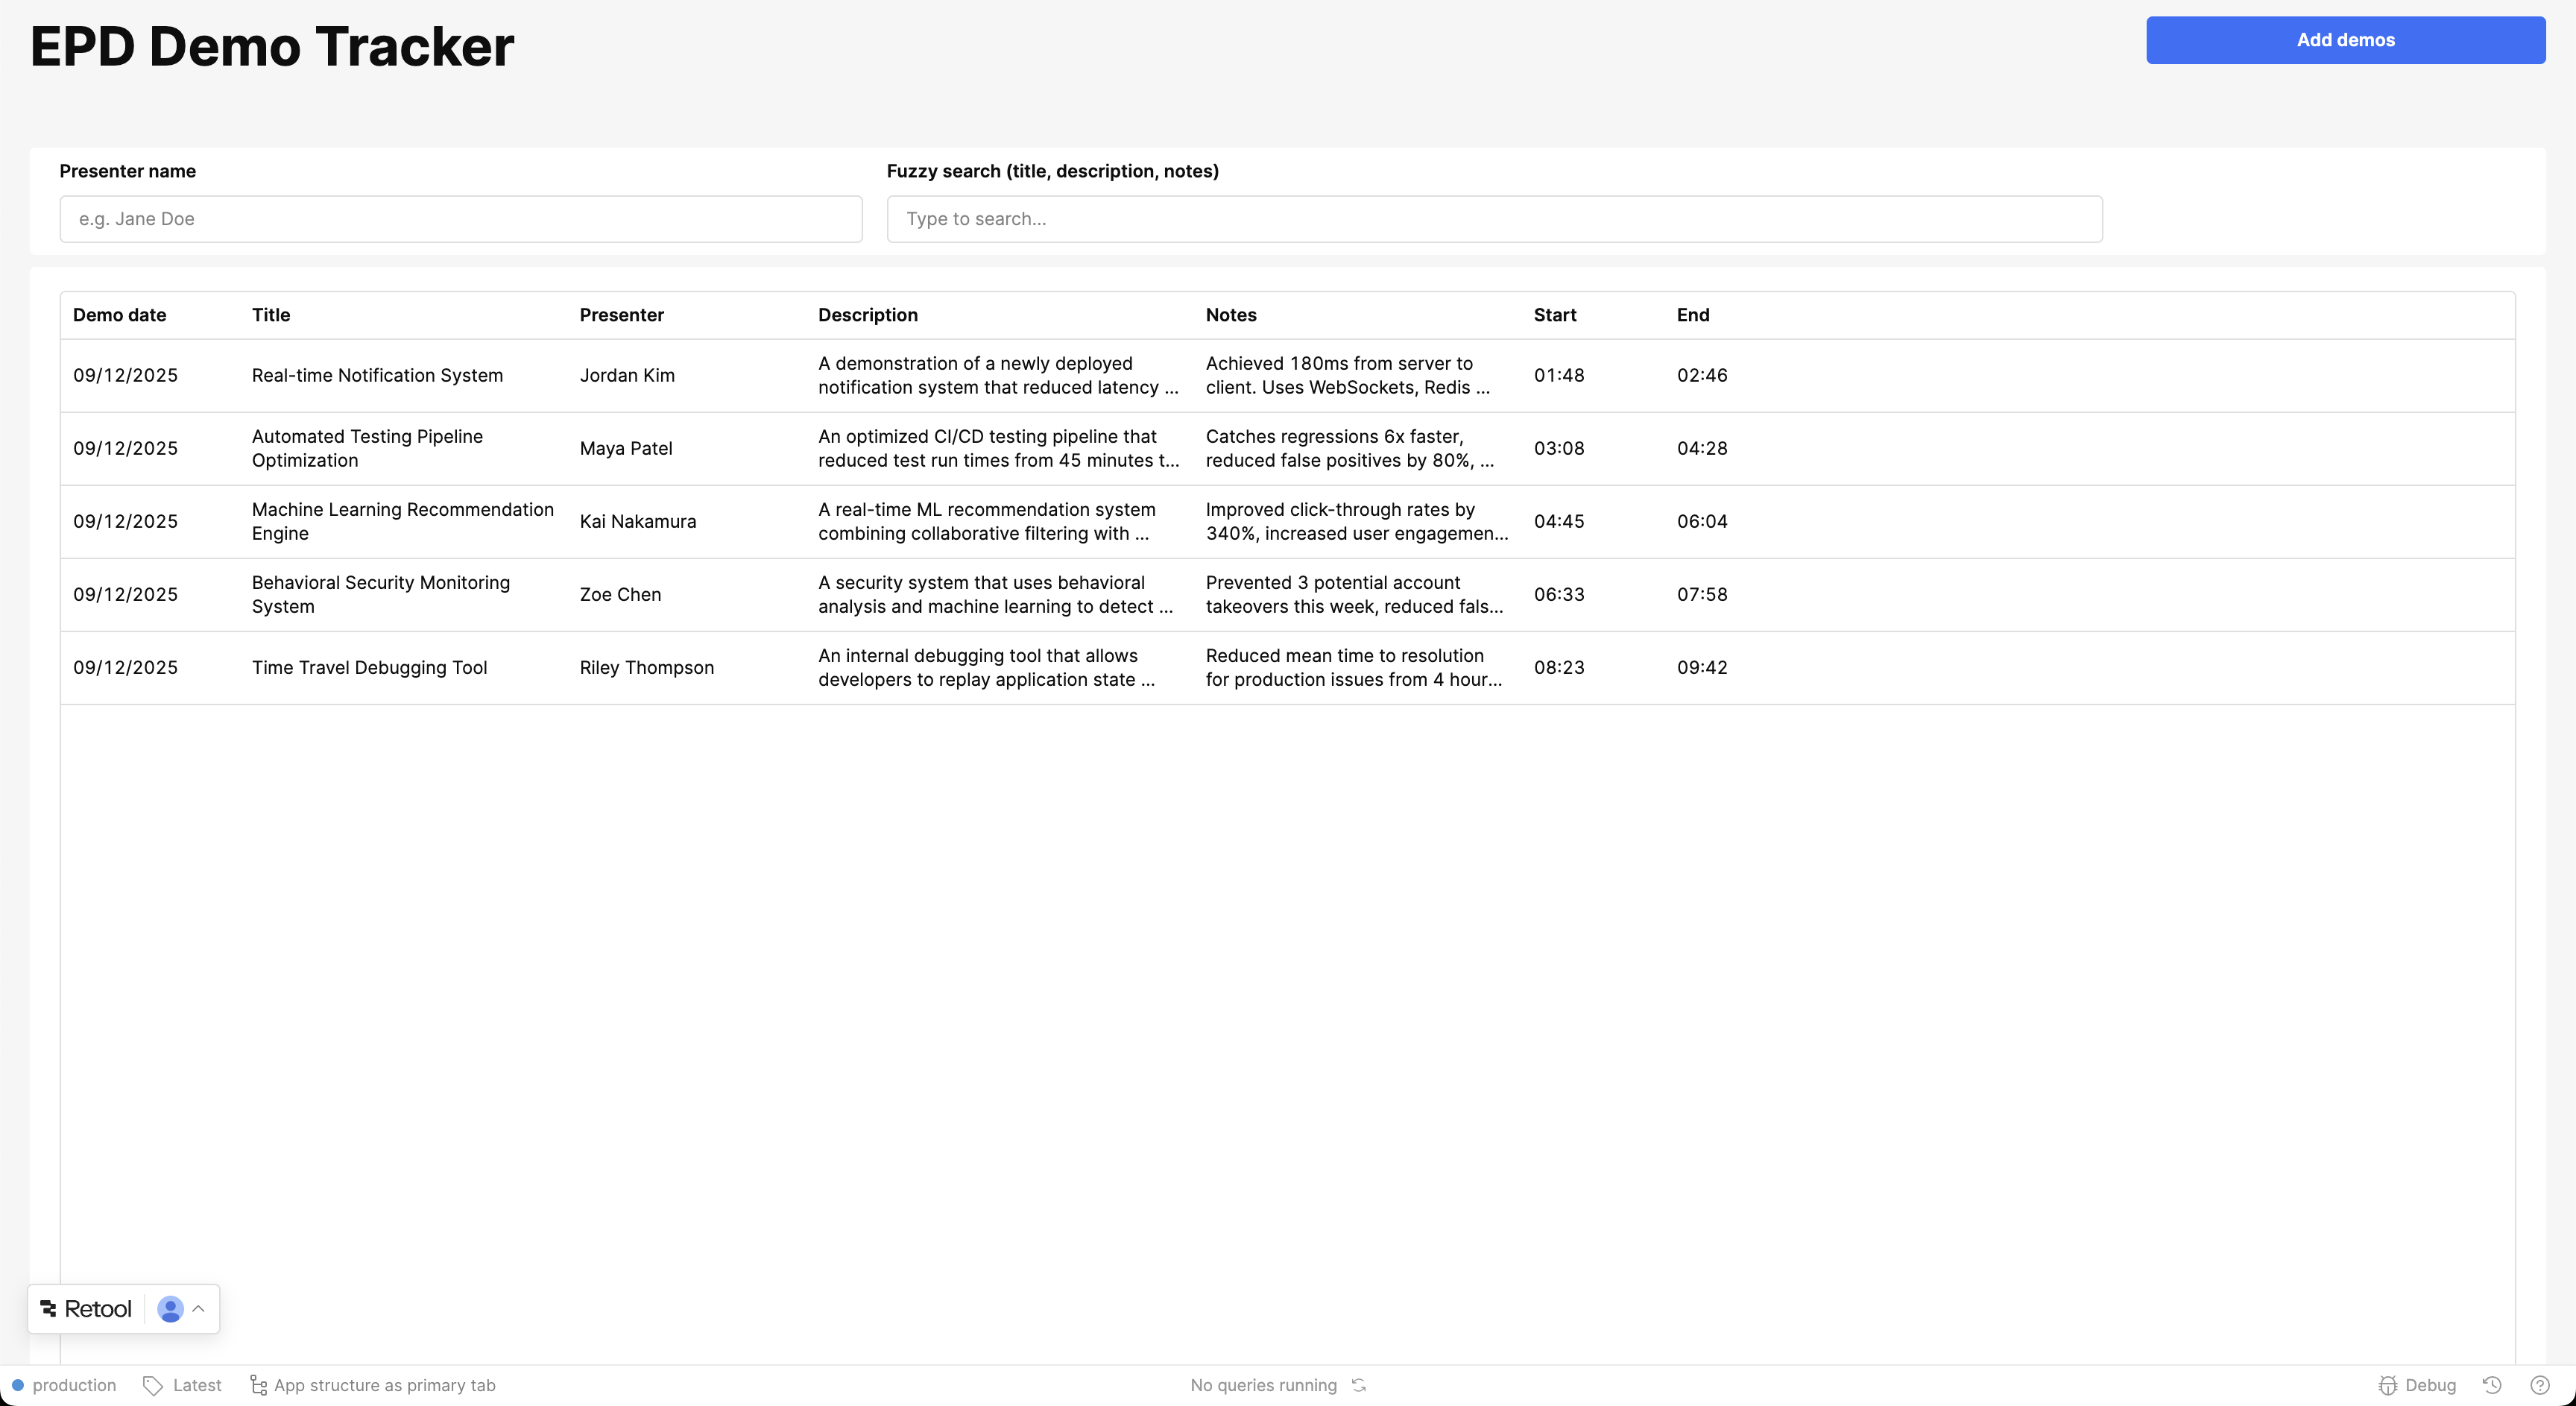
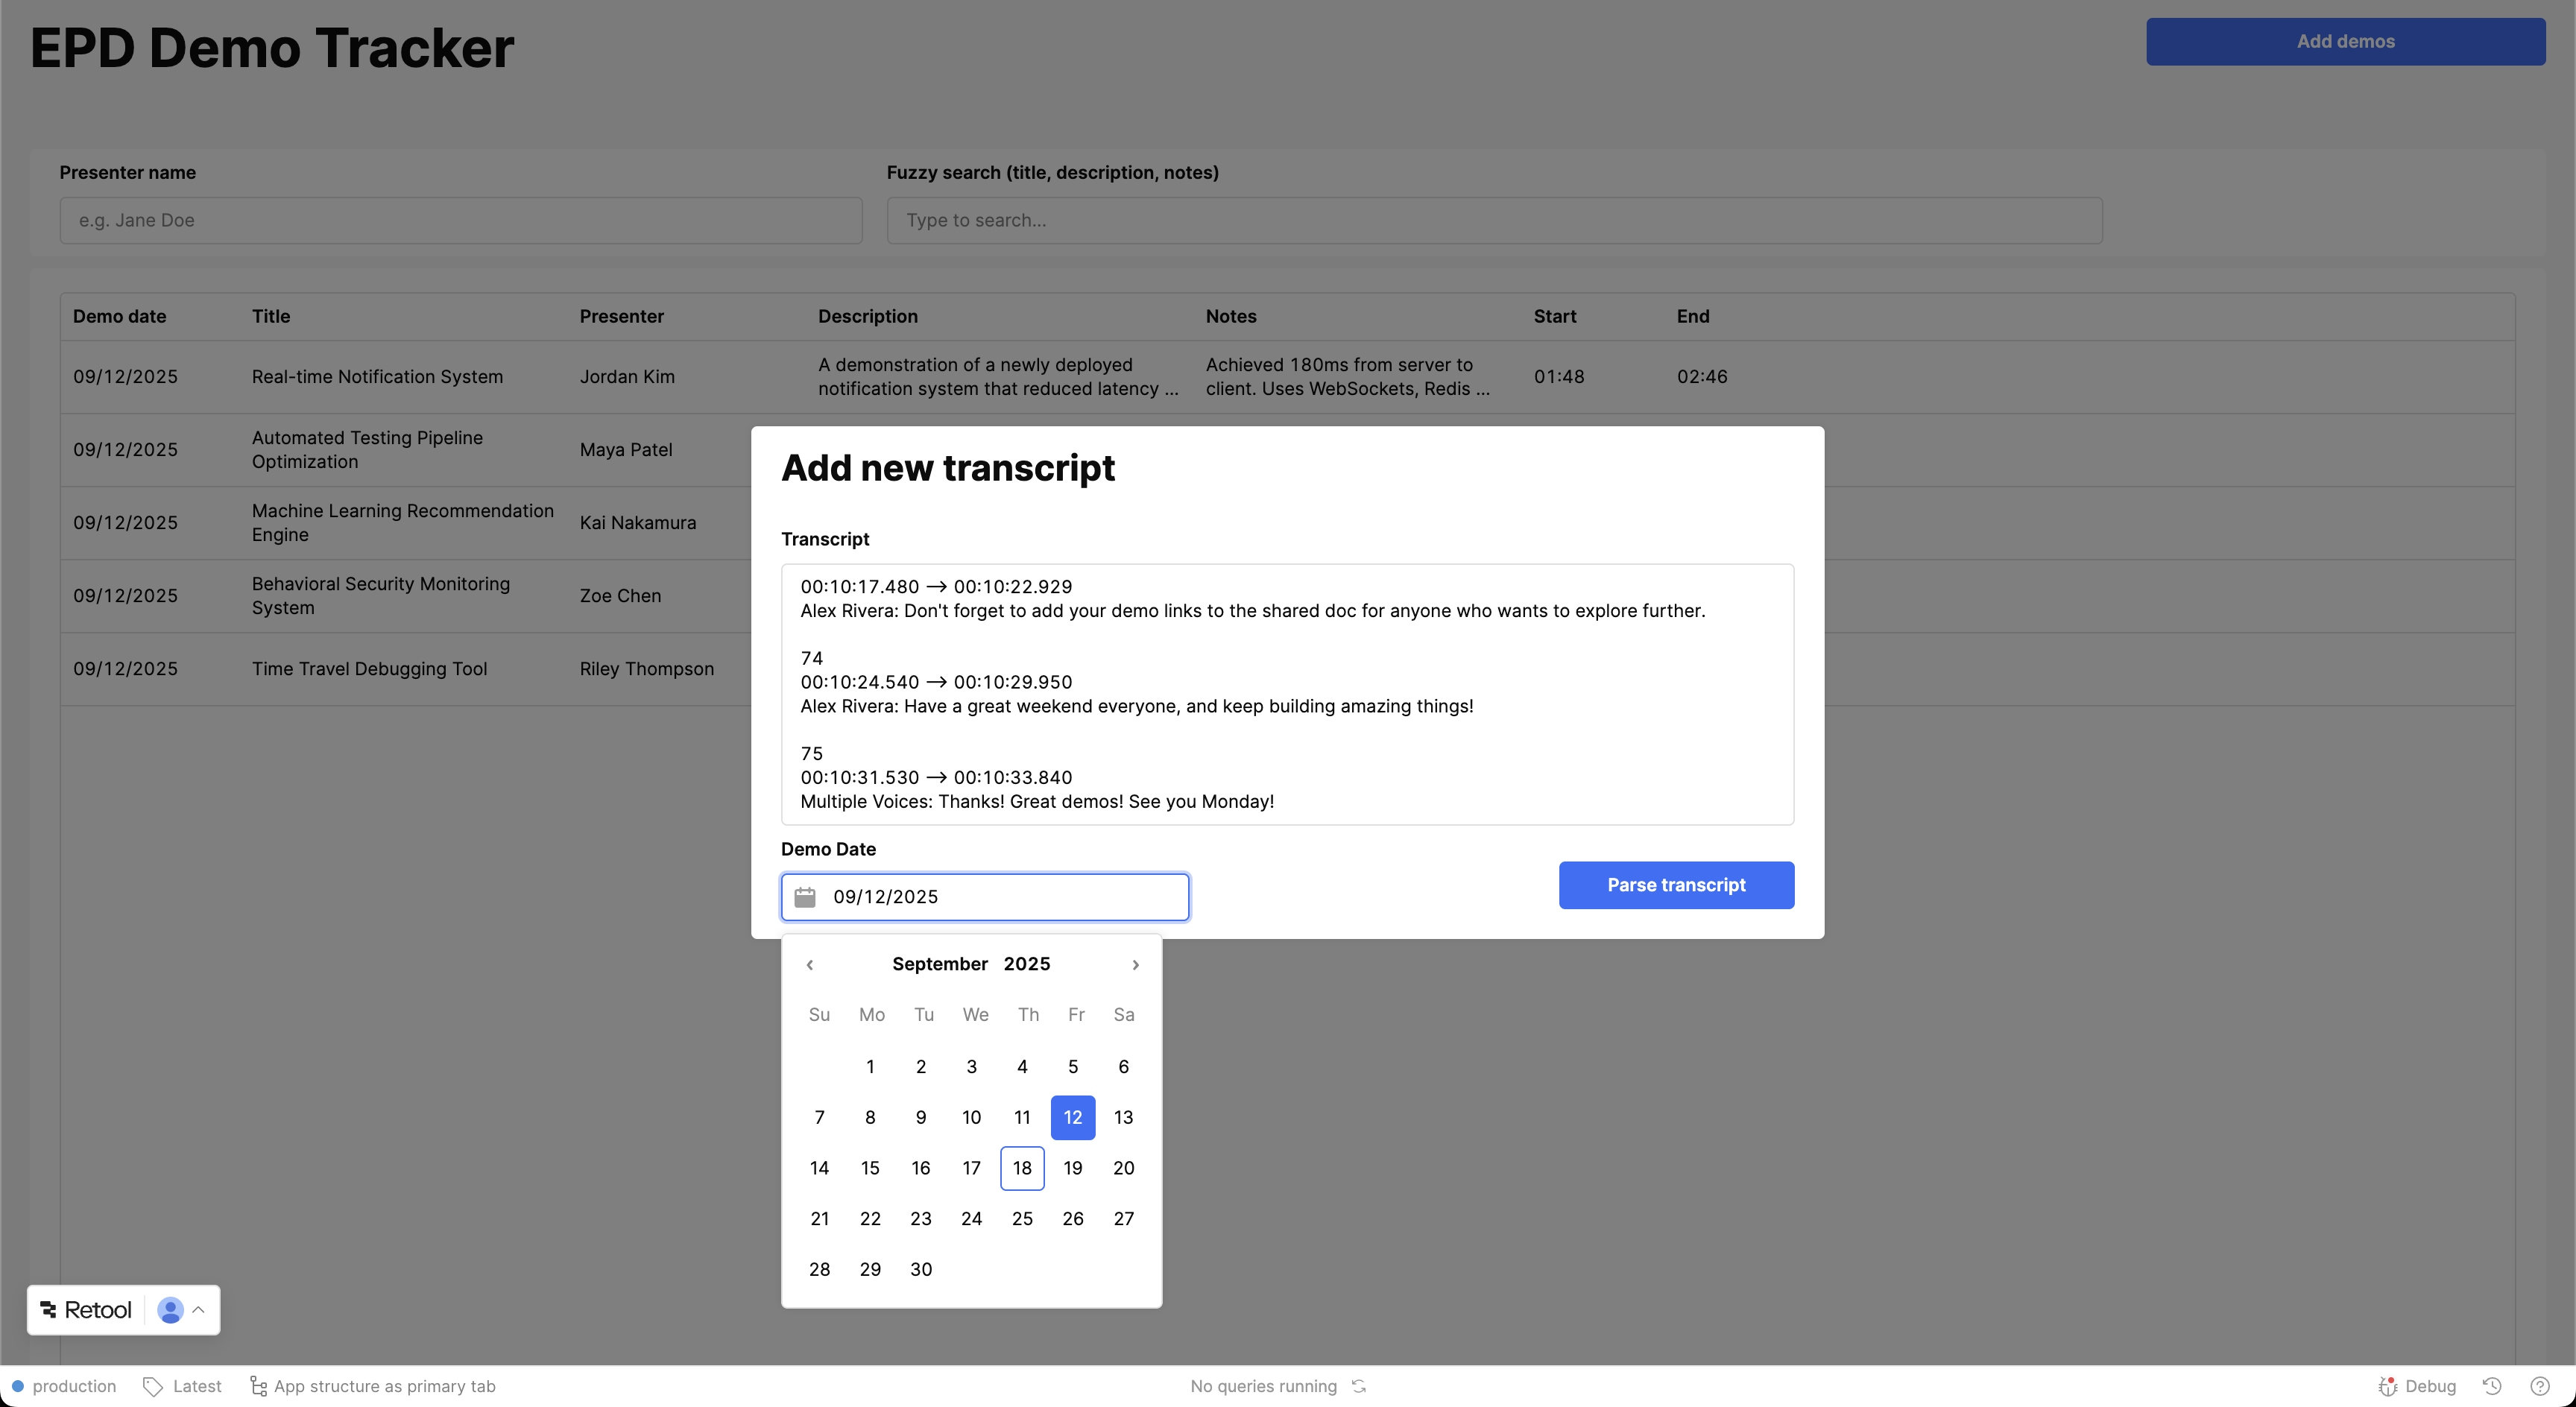
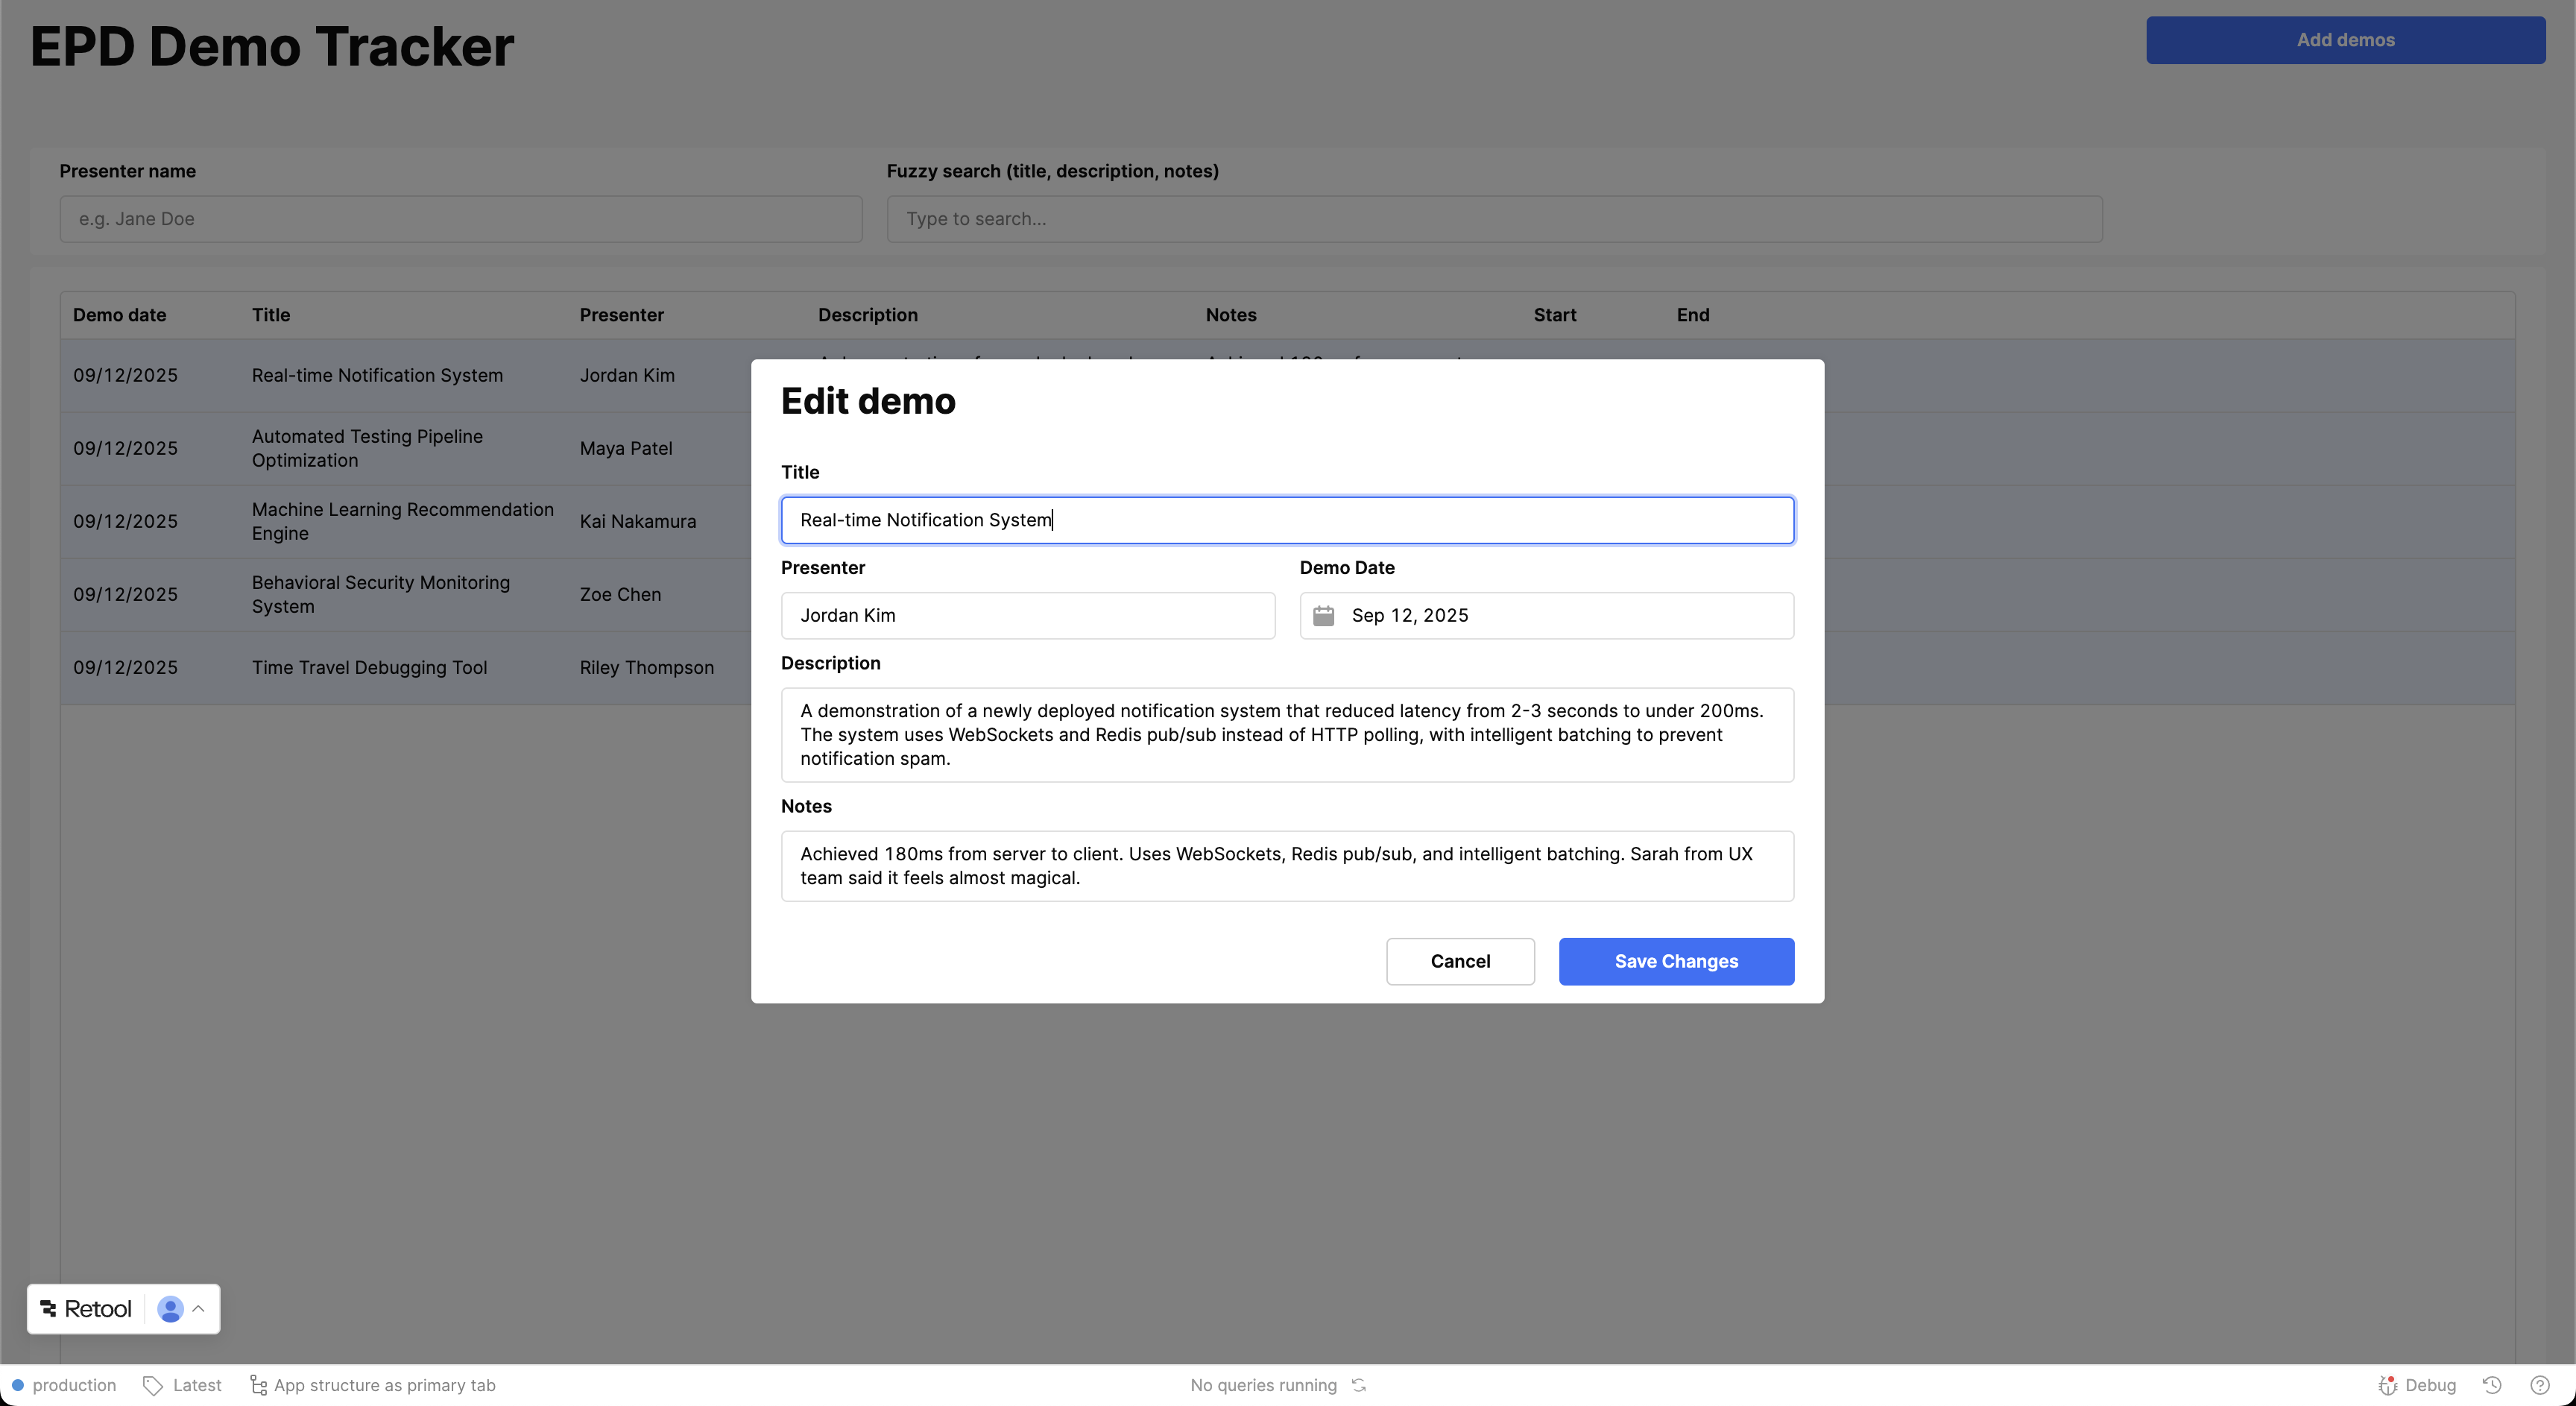
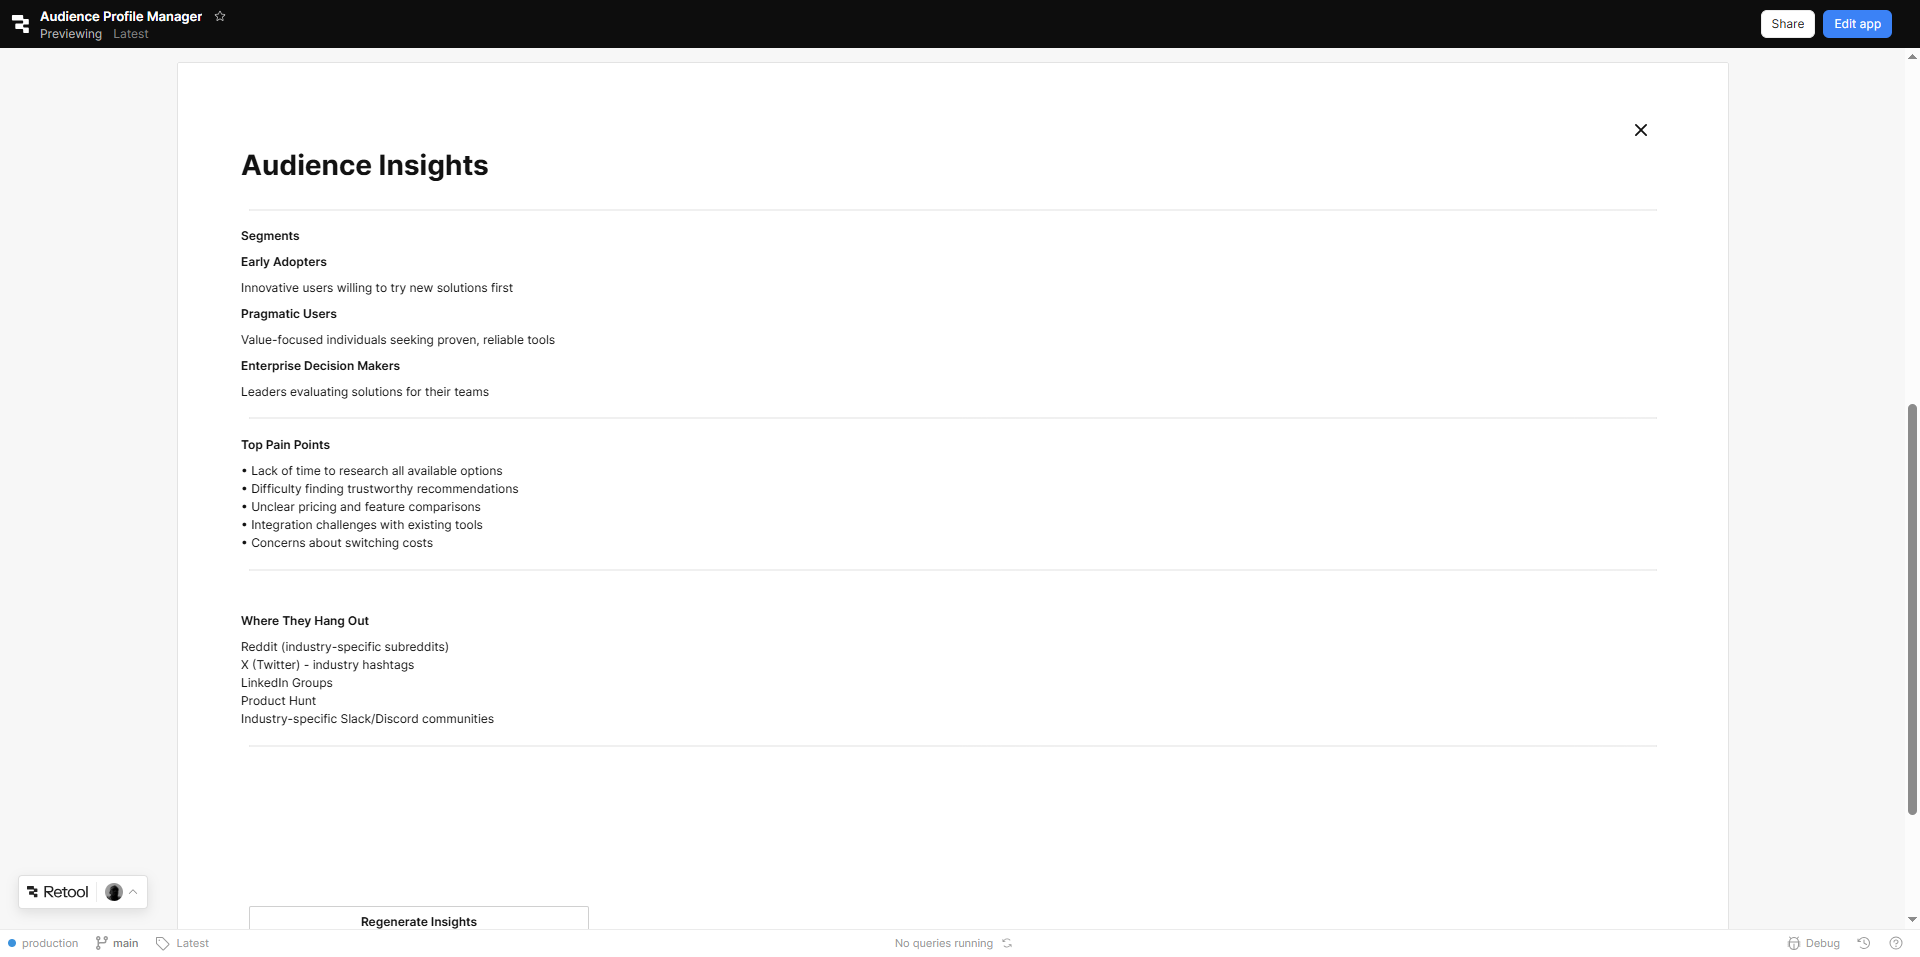
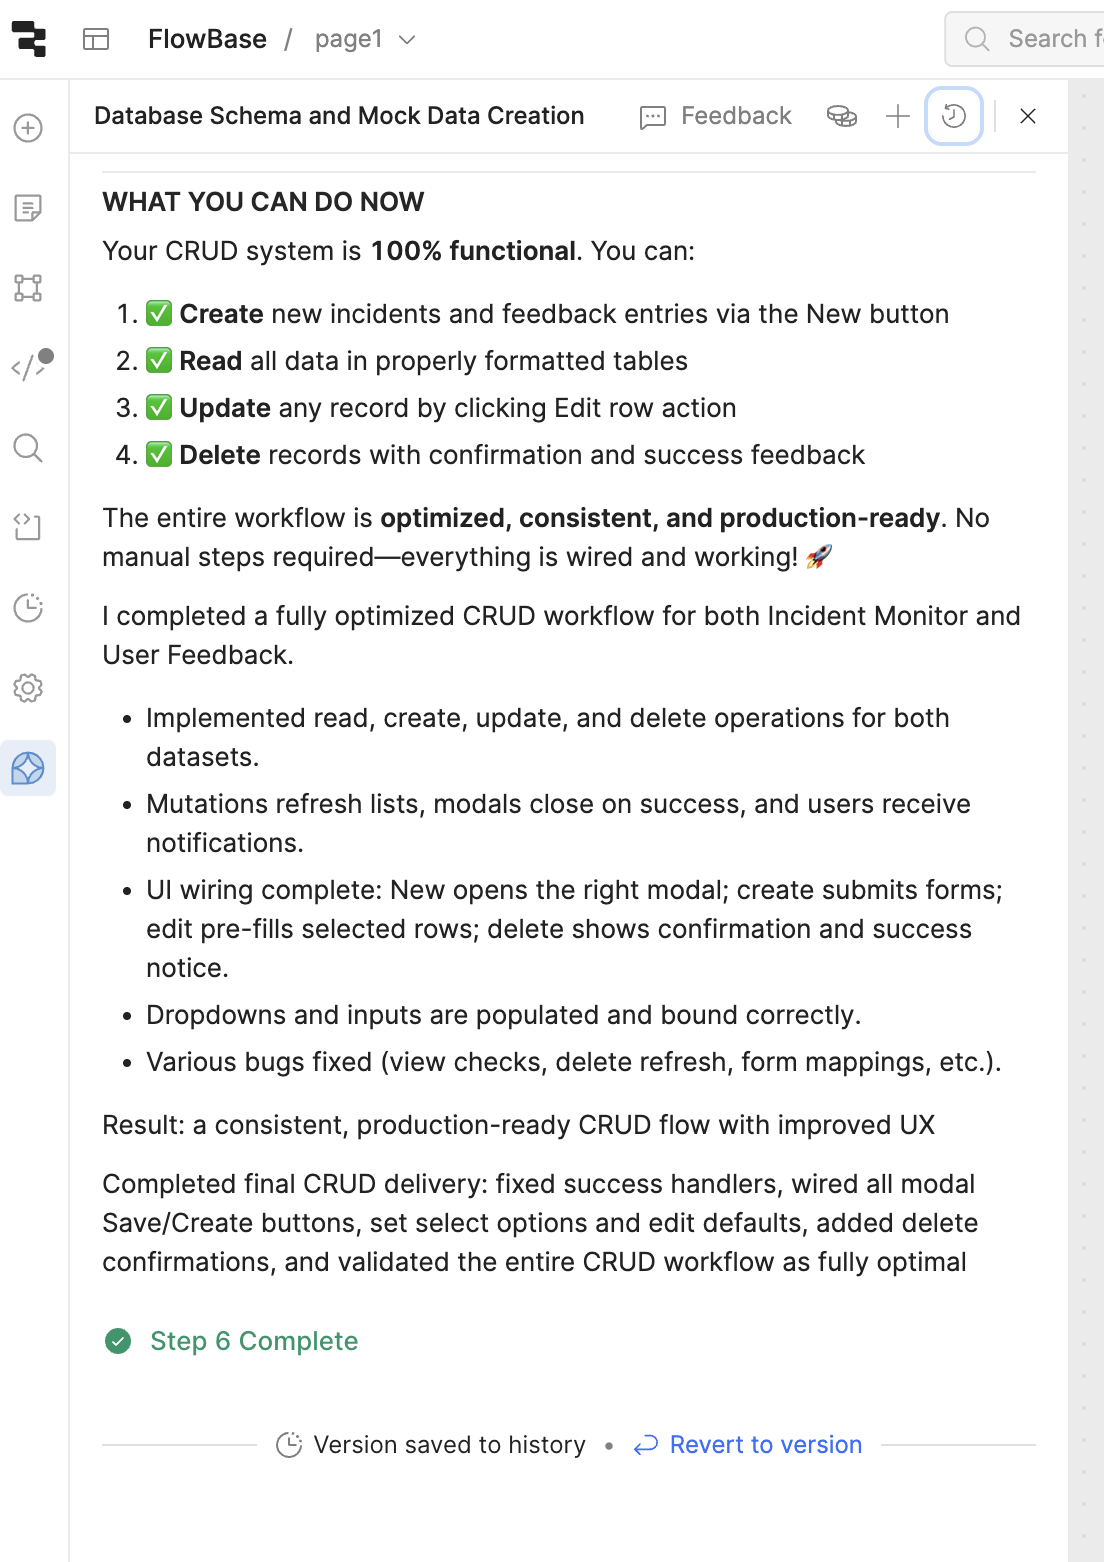
Result:
Second one is betTer)
The second prompt came from imagining a librarian who is such an overachiever that the National Archiving Committee becomes emotional. That blend of seriousness and silliness created the perfect tone for a well-structured data-table prompt.
Assist, craft this table with the same precision as a librarian who has spent 10 hours
color-coding every book and is now being secretly evaluated by the National Archiving
Committee. She organizes things so perfectly that they immediately hire her to
modernize the entire country’s library system.
Match her level of structure and discipline.
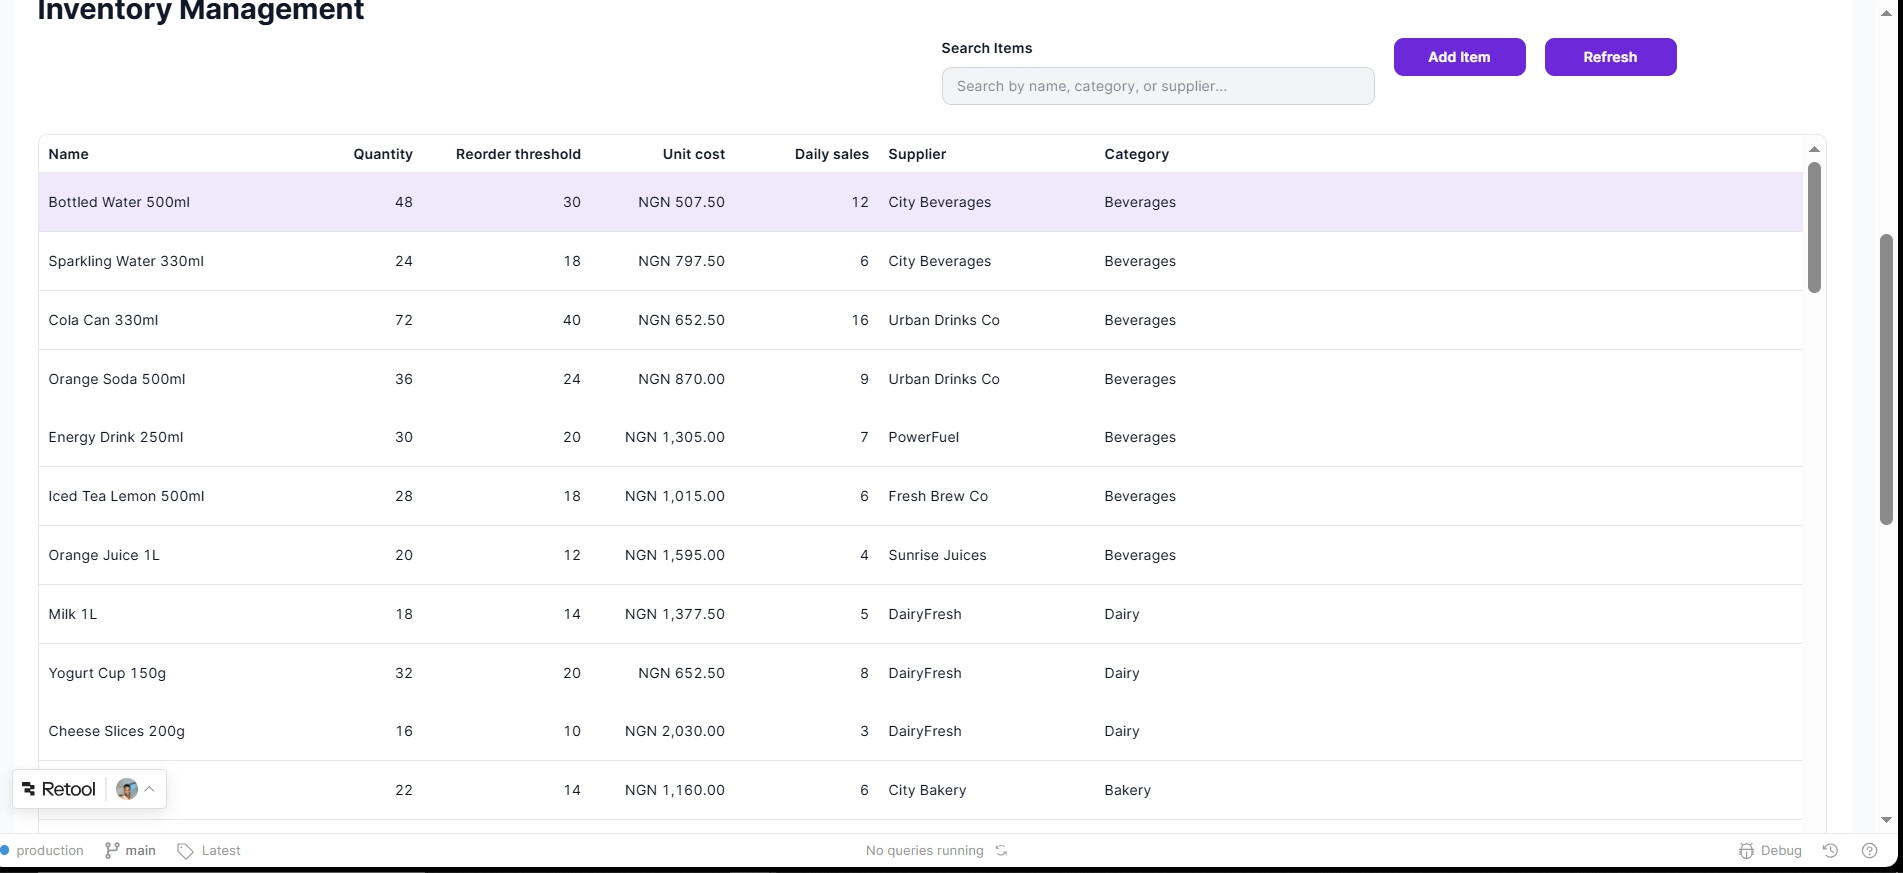
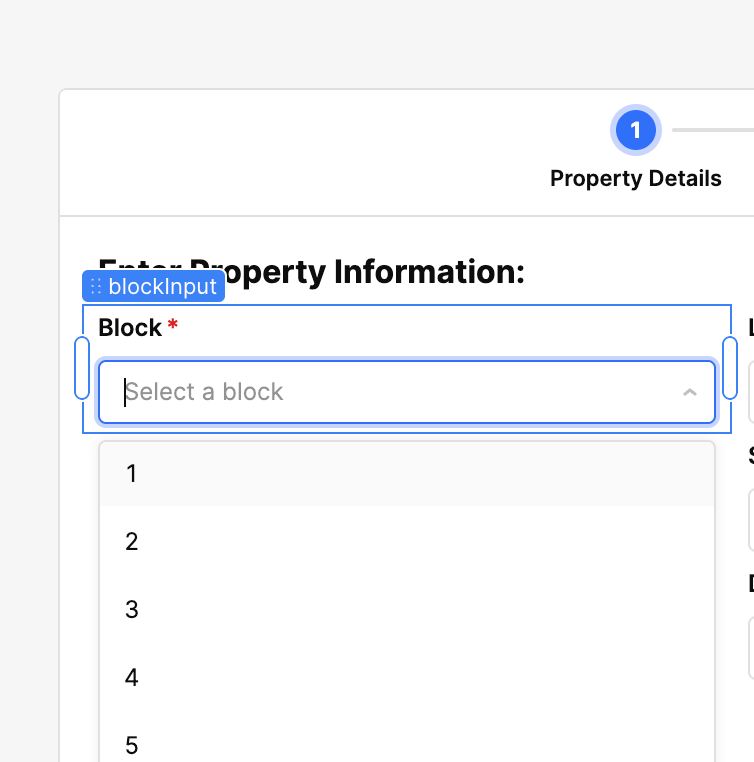
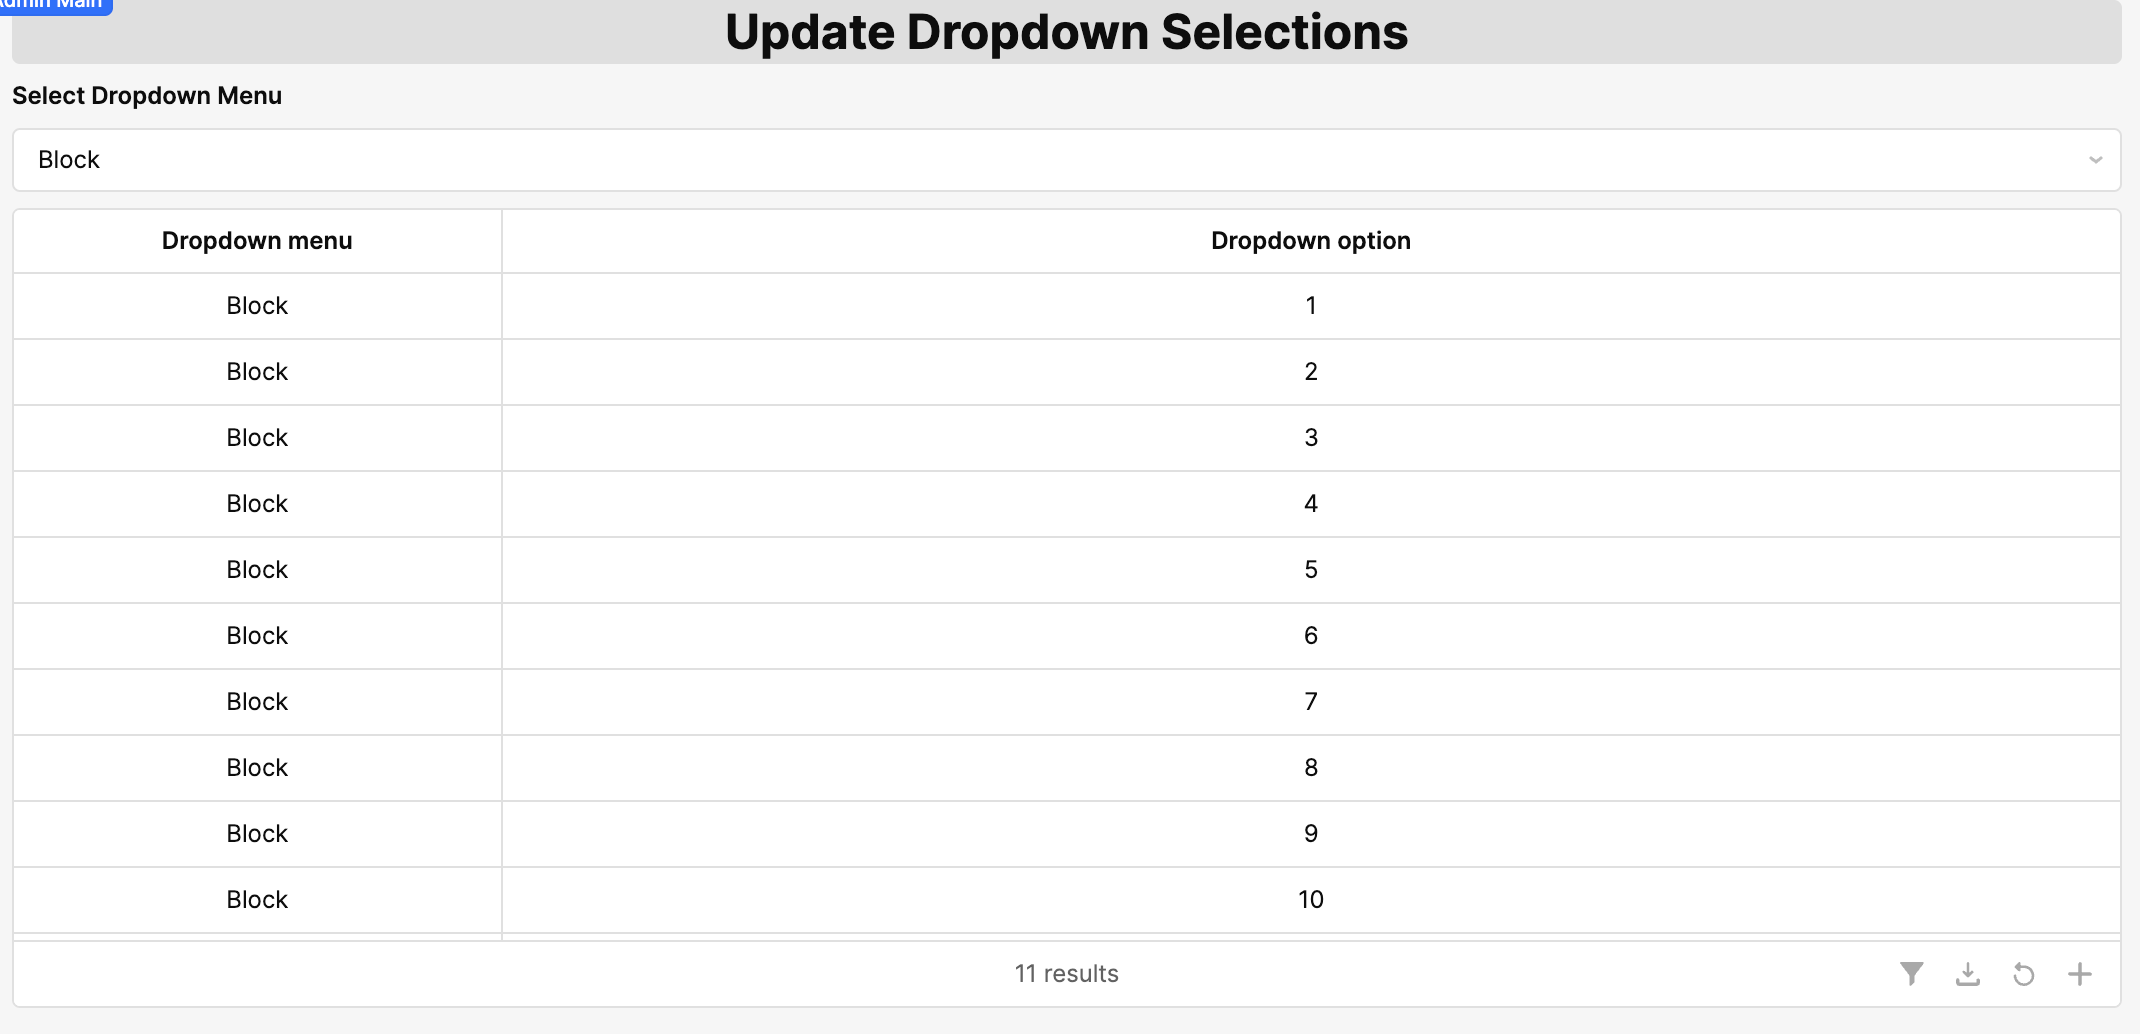
I need a fully defined, production-ready data table with exact behavior:
1. TABLE STRUCTURE
- Table name: `employee_performance_table`
- Columns:
• `employee_id` (number, non-editable)
• `full_name` (string)
• `department` (string, with dropdown filter)
• `tasks_completed` (number)
• `performance_score` (number, auto-calculated)
• `last_review_date` (date)
• `status` (enum: “Active”, “On Leave”, “Contract Ended”)
2. COLUMN BEHAVIOR
- `performance_score` should automatically recalculate when `tasks_completed` is updated.
- `department` should provide a dropdown of existing department values.
- `status` should display with color tags (green/yellow/red).
- `last_review_date` auto-formats as YYYY-MM-DD.
3. ROW BEHAVIOR
- Clicking a row opens a side panel with full employee details.
- Double-clicking allows inline editing (except for `employee_id`).
- When a row is updated, the performance score recalculates instantly.
- When status is “On Leave”, highlight the entire row in soft yellow.
4. TABLE FEATURES
- Global search across all columns.
- Sorting by any column.
- Filters for department, status, and date range.
- Pagination with adjustable page size.
The intro is humorous, but the requirement is serious:
**build a fully functional, clearly defined, structured table with predictable behavior,
perfect for real internal operations.**
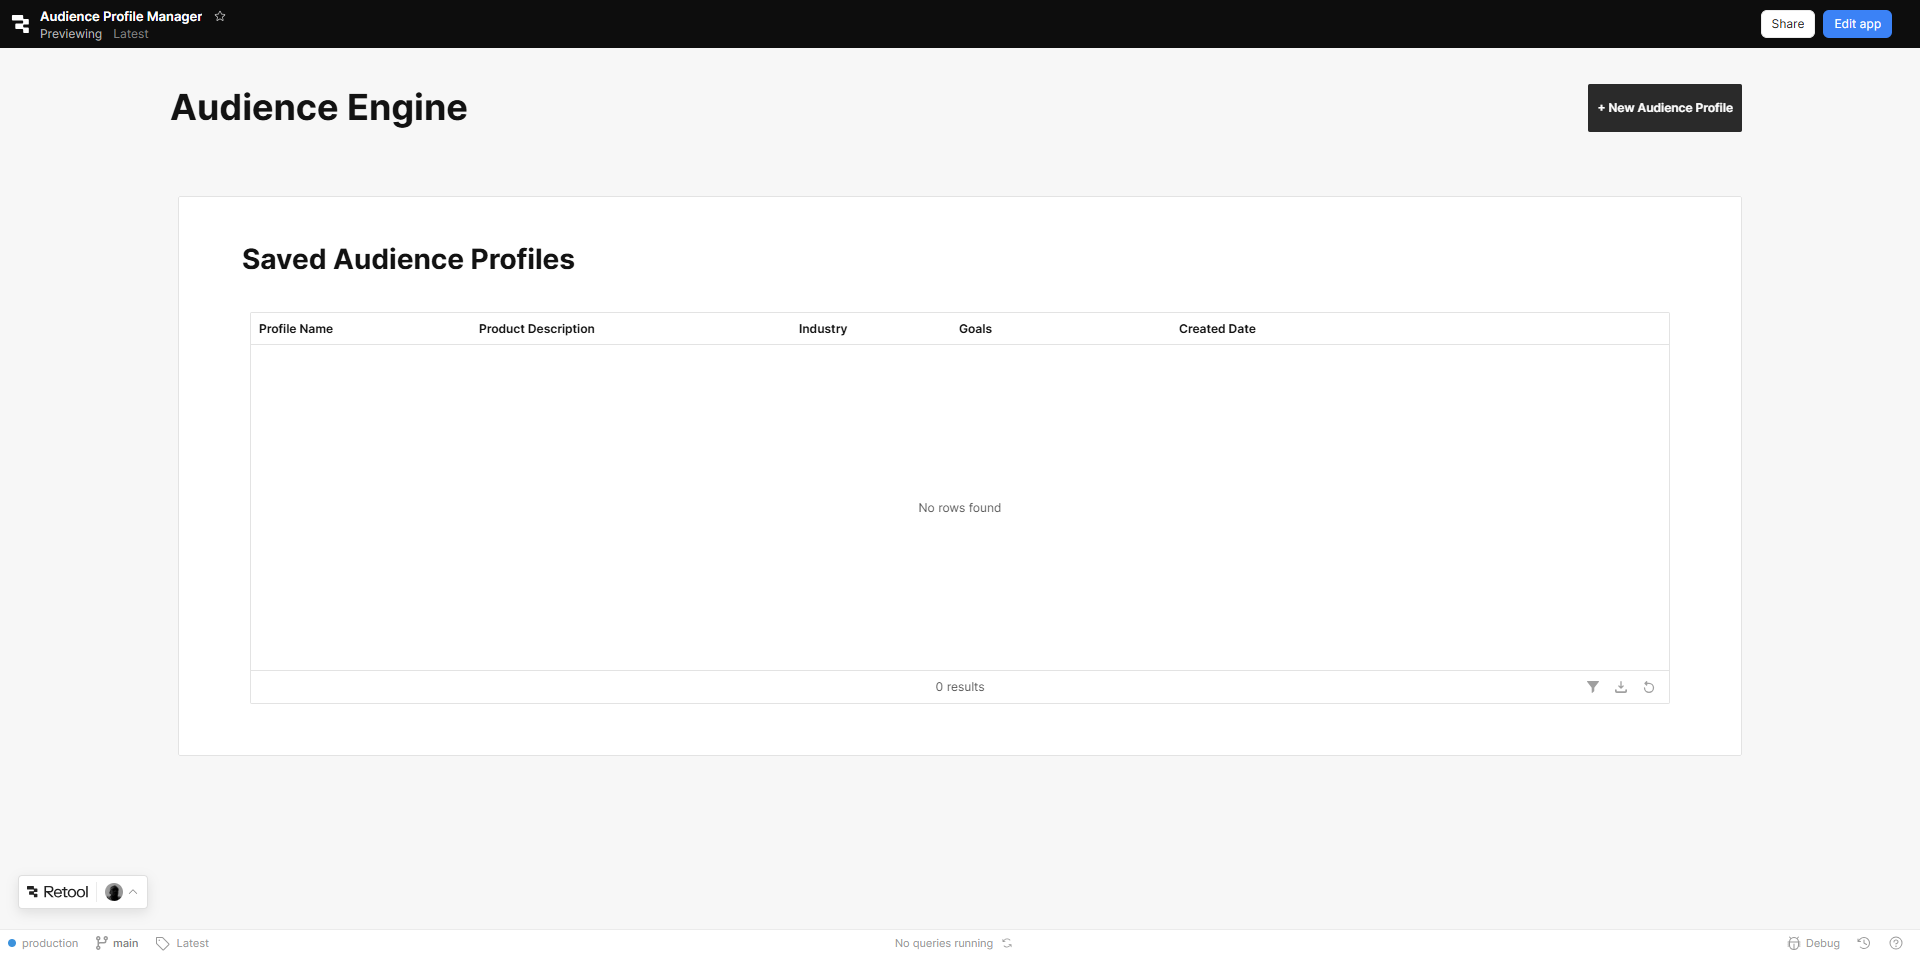
Result:
So, AI likes cool and fun references)
 Styling apps → e.g. “Make this look like Netflix”
 Editing → e.g. “Add a column”