Hi all,
I want to create a monitoring dashboard for disbursement that got stuck in pending status for some banks every minute. I am running this query
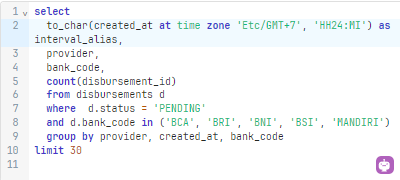
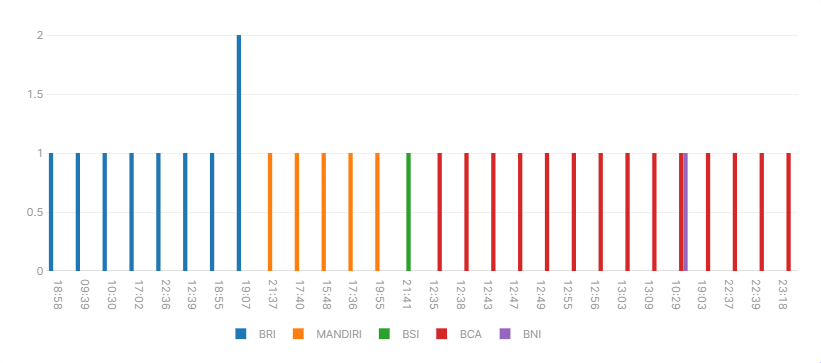
and try to visualize it on bar chart with time on x-axis. but problem is, i could not find a way to run x-axis as the actual time with range 0-15 minute. instead, i could only put the created_at data as timestamp in x-axis
Hello @max_arf!
Hope to get some clarification on how you would like to have the time and x-axis set up. You mention that you want a range of 0-15 minutes, how do you want to determine the start time for this range?
How is the actual time and the created at time different? Do you want to order the created_at times listed in your screen shot, as it looks like they are currently not chronological.
If you could give me an example with a smaller limit of 3 or 5 pending datapoints that could be more useful. Or if you have another table online that you would like to emulate in plotly I might be able to help with that!
Here is some docs from plotly that might be able to help you find the optimal way to input you data to get the desired chat!