Hi! I have a dataset of continuous & discrete numeric values and want to visualize the histogram for some of the columns in my dataset. Is there a built in way to do that or can someone suggest me a possible workaround to do that by using the plotting components in a subtle way. Thanks!!
1 Like
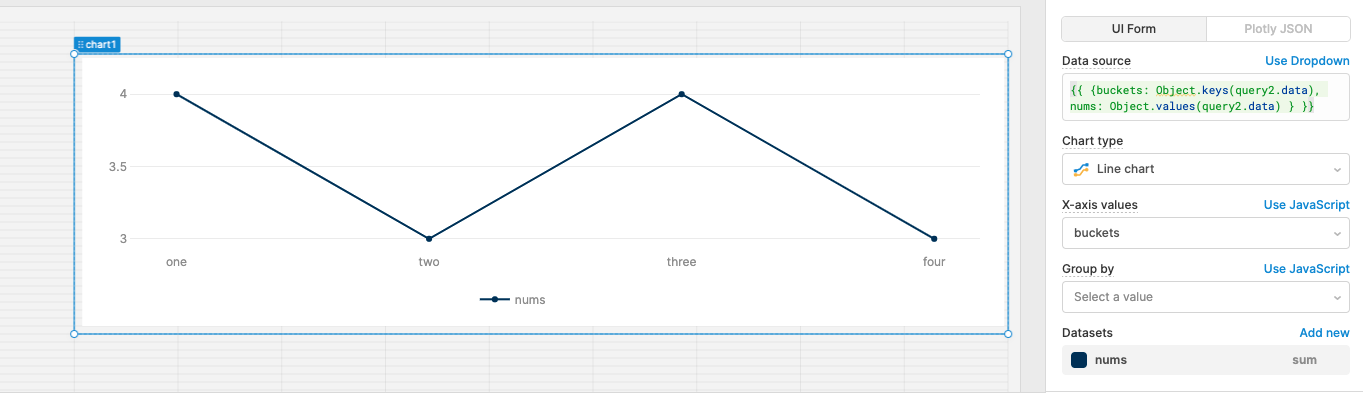
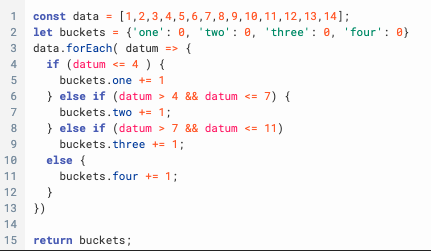
Hey mzamir! There isn't a native way to do this, but you cold easily format the data that you have into values that would display well on a line chart. Here I have a very simple dataset. I lump the values into different buckets and we can see their distribution on the chart. The implementation could definitely be different, but wanted to construct a simple example for you.
Hope this helps!