Hi Retool community!
I am building a heatmap in the Retool app and there are a few questions I can't find a solution for. Here are the main features needed for the map component:
- There might be selected 1 or 100K addresses, and I need the map to automatically adjust so that points are visible no matter how many addresses are selected.
- Users might want to zoom in to view data at the city level, but also zoom out to see country-level data. The map should make it easy to see density at all zoom levels.
- There are 2 types of addresses that can be selected, and based on the type selected, different colors should be used. There might be only one type selected to show on the heatmap, or both.
Below is my JavaScript code with coordinates (name of this is geoJSONCoordinates ):
const sqlData = formatDataAsArray(mapCoordinates.data);
const features = sqlData.map((row, i) => ({
  type: "Feature",
  geometry: {
    type: "Point",
    coordinates: [row.longitude, row.latitude]
  },
  properties: {
    weight: row.existing_organiser === 'true' ? 1 : 0.5,
    existing_organiser: row.existing_organiser
  }
}));

return {
  type: "FeatureCollection",
  features
};
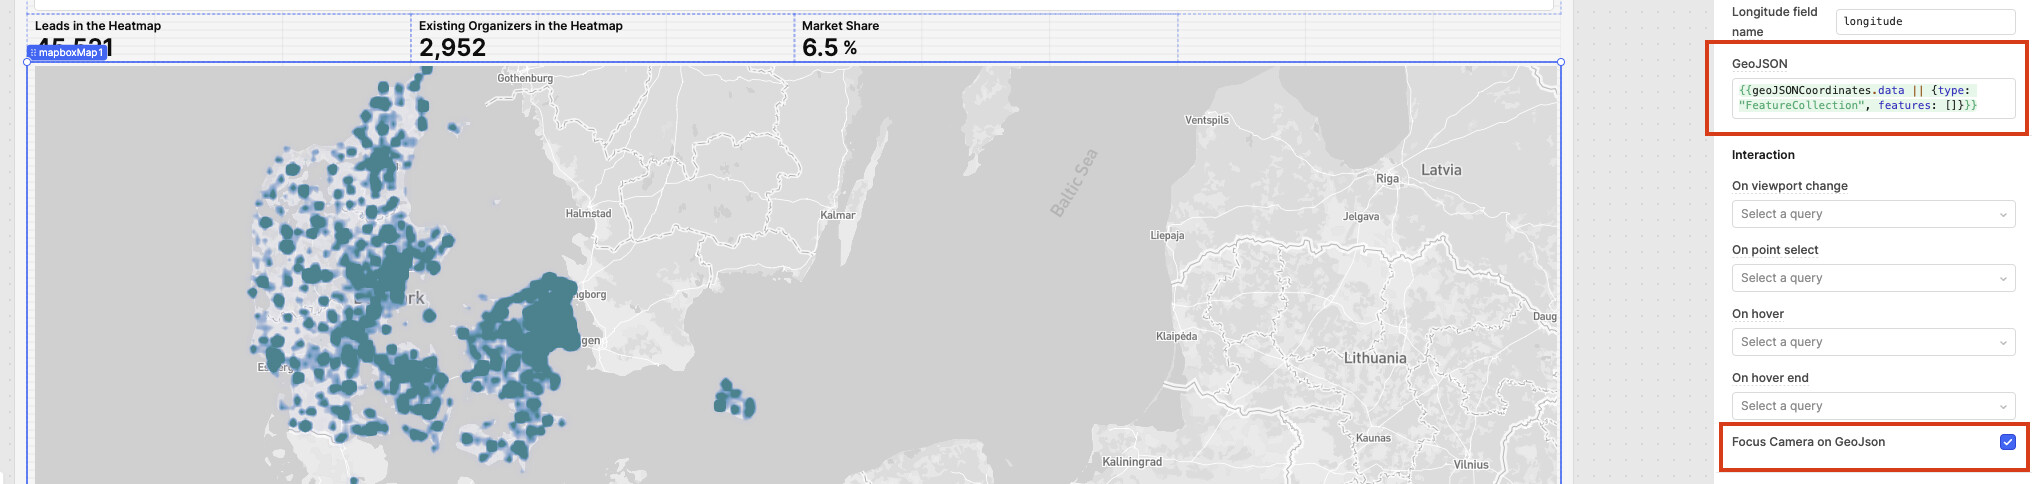
I'm using this in the MapBox component GeoJSON property as follows:
{{geoJSONCoordinates.data || {type: "FeatureCollection", features: []}}}
Here is my current GeoJSON layer styling:
{
    type: 'heatmap',
    maxzoom: 15,
    paint: {
      // increase weight as diameter breast height increases
      'heatmap-weight': {
        'property': 'density_adjusted_weight',
  'type': 'exponential',
  'stops': [
    [0, 0.1],
    [10, 0.3],
    [100, 0.5],
    [1000, 0.8]
  ]
},
      // increase intensity as zoom level increases
      'heatmap-intensity': {
        stops: [
          [5, 0.1],  // Reduced intensity at lower zoom levels
        [11, 1.5],
    [15, 5]
        ]
      },
      // assign color values be applied to points depending on their density
      'heatmap-color': [
        'interpolate',
        ['linear'],
        ['heatmap-density'],
  0, 'rgba(236,222,239,0)',
  0.1, 'rgba(208,209,230,0.3)',
  0.3, 'rgba(189,200,225,0.1)',
  0.5, 'rgb(166,189,219)',
  0.75, 'rgb(103,169,207)',
  1, 'rgb(28,144,153)',
  1.5, 'rgb(1,108,89)'  // Higher density now has a distinct color
],
      // increase radius as zoom increases
      'heatmap-radius': {
        stops: [
          [1, 1],
    [8, 10],
    [11, 15],
    [15, 20]
        ]
      },
      // decrease opacity to transition into the circle layer
      'heatmap-opacity': {
        default: 1,
        stops: [
          [14, 1],
          [15, 0]
        ]
      }
    }
  }
This setup works well when 1000+ addresses are selected, but when I select only 3 addresses, no points might be visible.
My questions are:
- How should I update GeoJSON layer Styling to make heatmap useful when no matter how many addresses are selected? I've tried to edit radius, but I can't find way to make it work for no matter how many addresses are selected.
- How to make different colors for different type of address?
I would really appreciate it if someone could help me solve this. ![]()