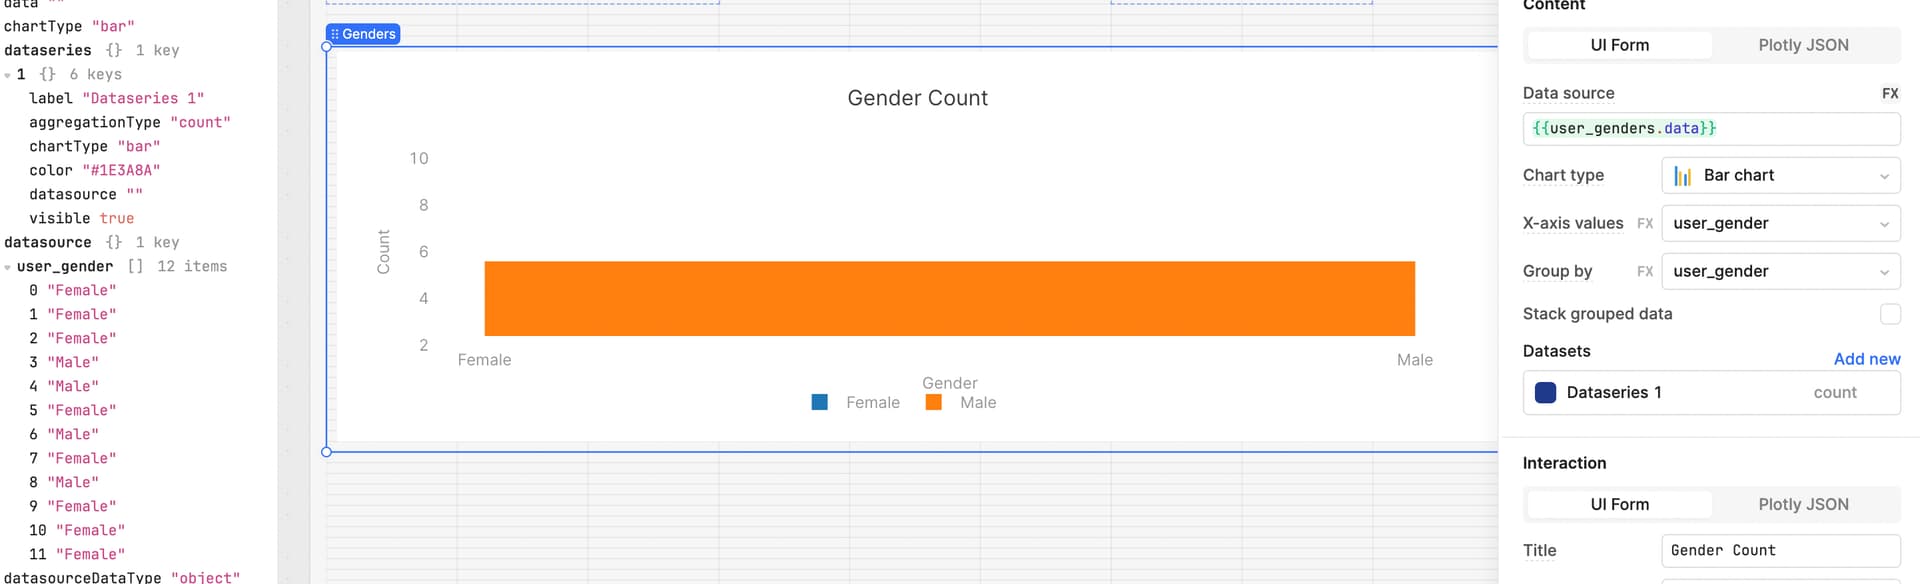
My query has both values of Male and Female but only Male value shows on bar chart. Sorry I am new to Retool, thanks for any help!
I'm not super familiar with the component so maybe there's an easier way to this this by just feeding it an array but here's what'll work in this instance.
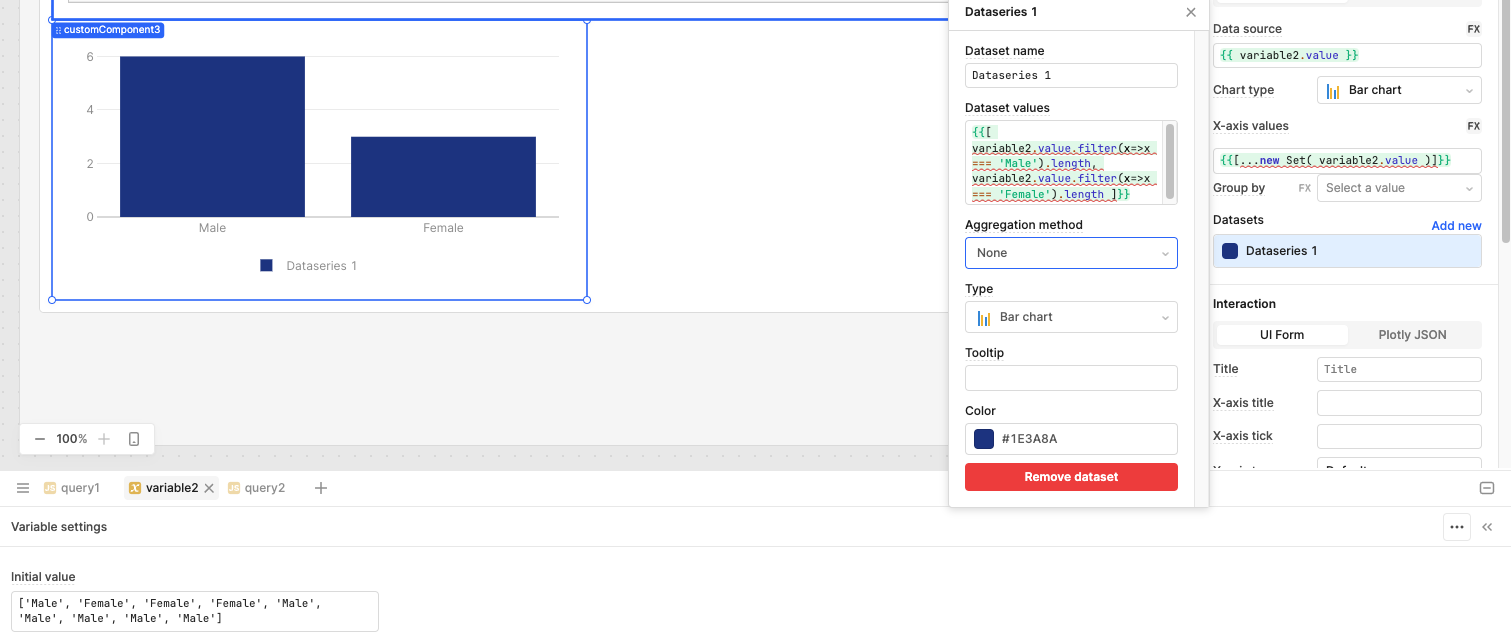
The chart seems to want an array with a value for each x-axis label and then an array with the same number of elements that populates the y-axis.
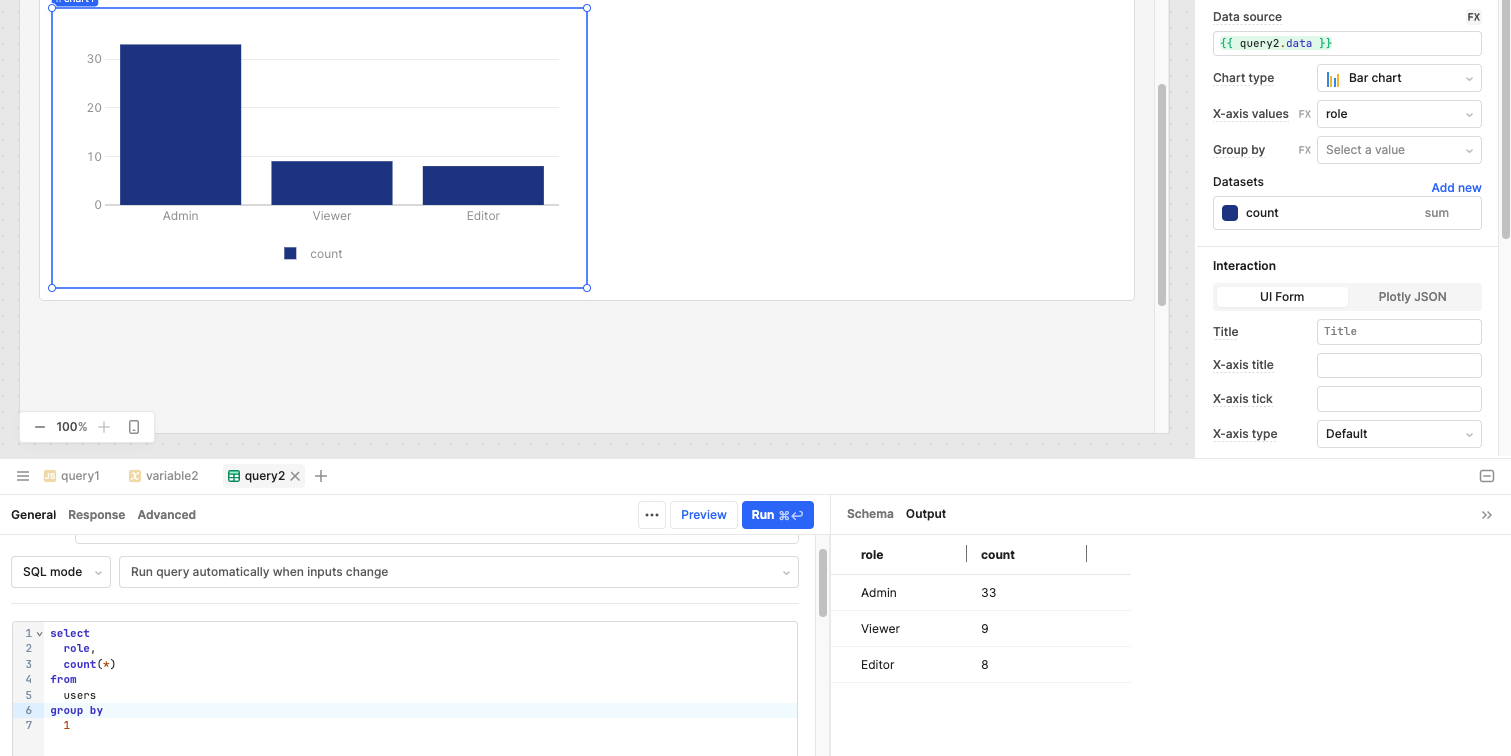
If you your data is from a SQL query you're writing I think you can simplify this a bit by handling the count and grouping there instead of in the chart component.
select gender, count(*) from table_name group by gender
This data will plug directly into that chart without any need to transform or adjust.