Mapbox Marker Not Plotting

I'm trying to do a simple lat/lon plot on a map where I pull the lat/lon from a selected row in a table.

I can see that there are values from lat/lon when I hover over the data source but it doesn't seem to want to put a plot marker on the map.

Any ideas where I might be going wrong? Thanks!

Hi @NightTimeNoche!
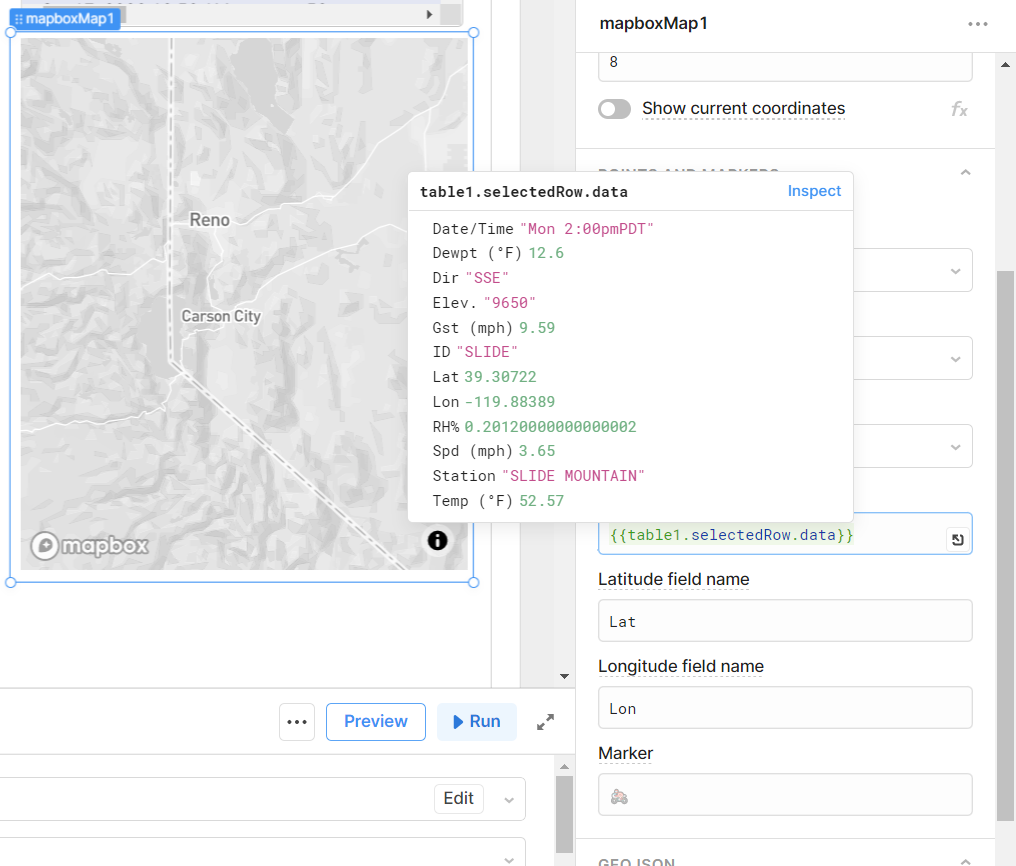
You are displaying all the information of the row. The mapbox points only accepts an array of objects containing lat/lon.
When you first placed the mapbox, it should have populated sample there that you can follow the format, i.e.

{{[
    { longitude: '-122.4194', latitude: '37.7949' },
    { longitude: '-122.4794', latitude: '37.7749' },
    { longitude: '-122.4194', latitude: '37.7049' },
]}}

You can adjust that to look like:

{{[
    { longitude: table1.selectedRow.data.Lon, latitude: table1.selectedRow.data.Lat},
]}}

or transform that somewhere so you'll just use {{transformer1.value}} in the points field.

That worked! Thank you so much.