Hi All ,
Me again with another question.
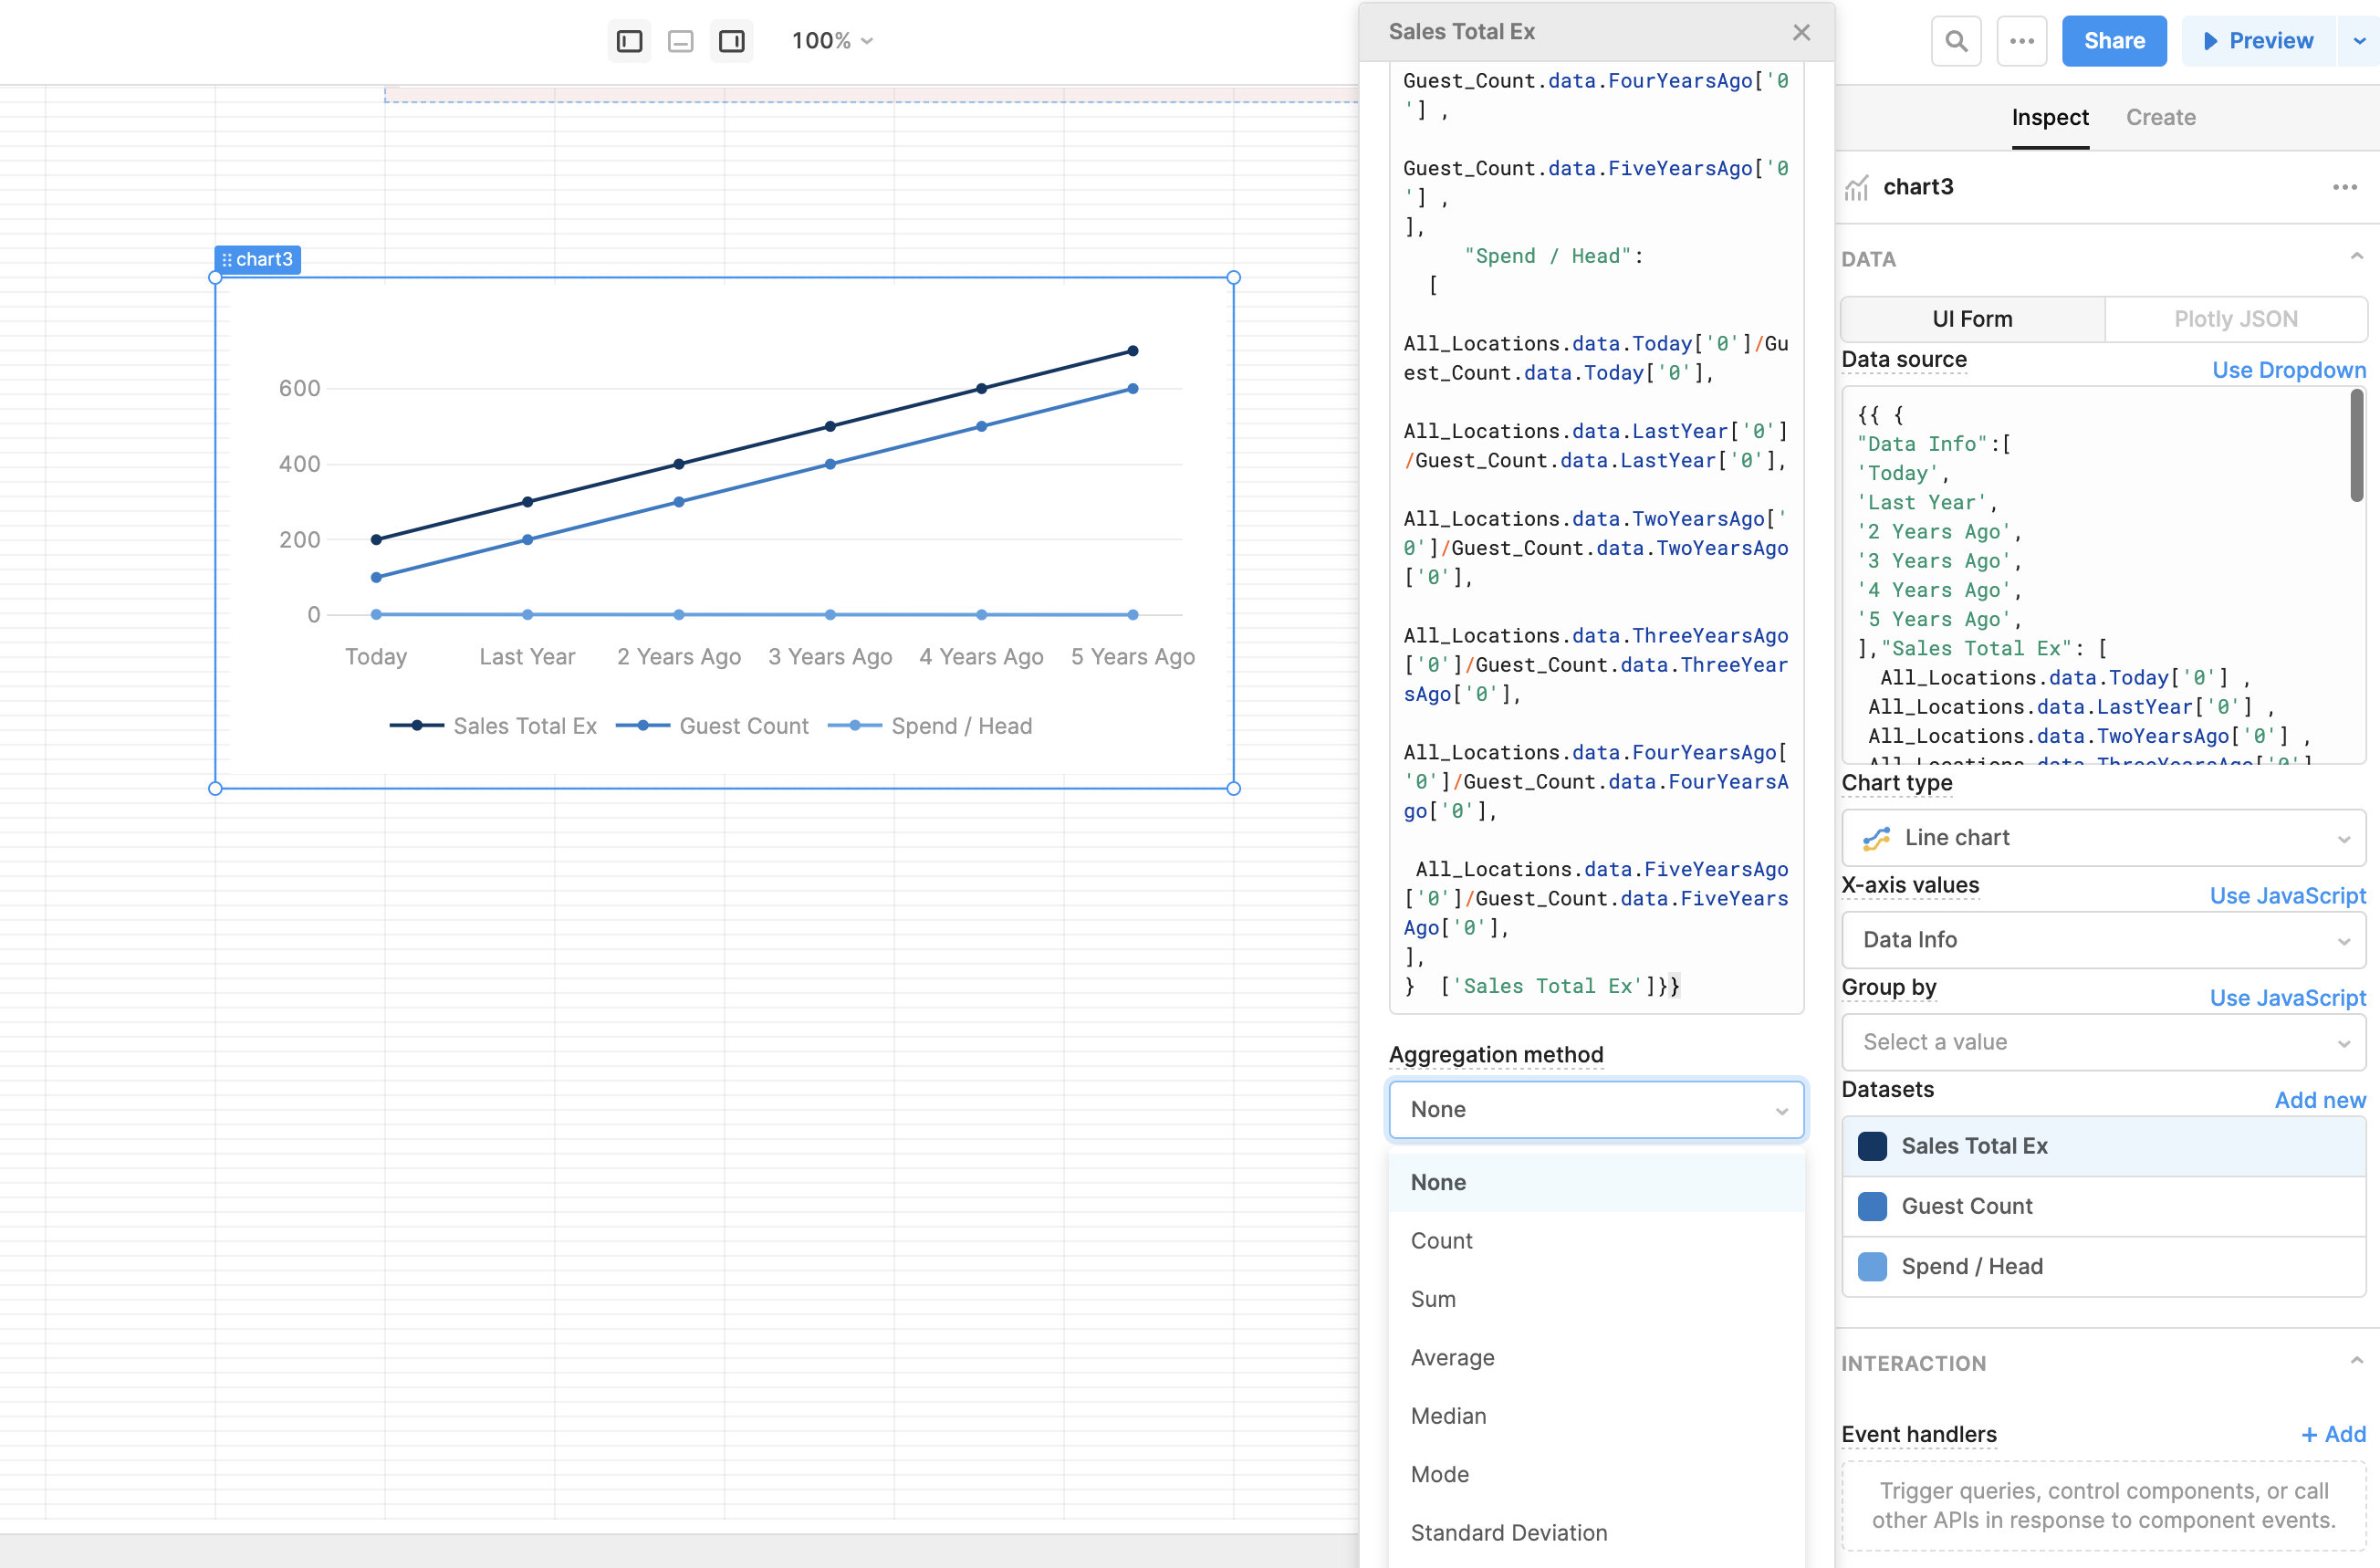
Trying to build a line chart using the below code but keep getting an error.
My Data source is a copy / paste from my table which loads all the data correctly.
My Graph settings are
- Data source as per below. (Copy Past from Working Table)
- Line Chart
- X Axis : Data Info
- Group By: Not Set
-Data Sets: As added by data source.
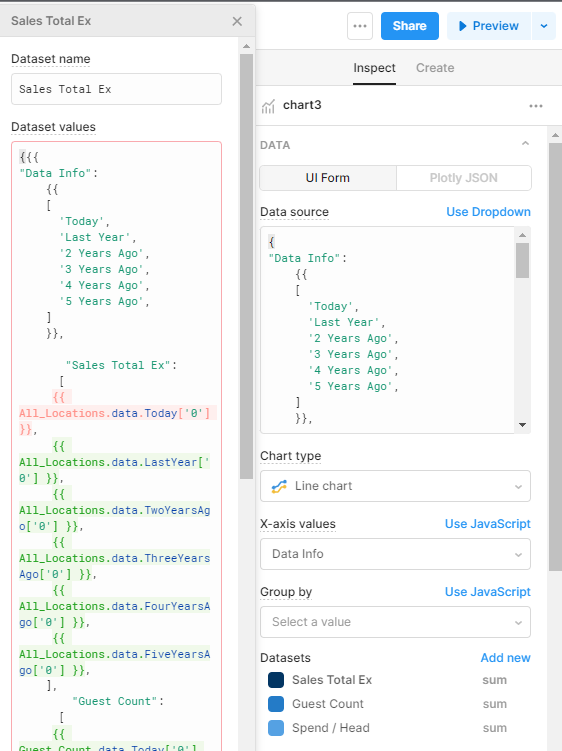
Now when i go into one of the data sets i can see there is an issue. The error it throws is an unexpected token has been found. Please make sure your JS syntax is correct.
This is the same error on all three data sets.
{
"Data Info":
{{
[
'Today',
'Last Year',
'2 Years Ago',
'3 Years Ago',
'4 Years Ago',
'5 Years Ago',
]
}},
   "Sales Total Ex":
  [
 {{ All_Locations.data.Today['0'] }},
 {{ All_Locations.data.LastYear['0'] }},
 {{ All_Locations.data.TwoYearsAgo['0'] }},
 {{ All_Locations.data.ThreeYearsAgo['0'] }},
 {{ All_Locations.data.FourYearsAgo['0'] }},
 {{ All_Locations.data.FiveYearsAgo['0'] }},
],
    "Guest Count":
  [
 {{ Guest_Count.data.Today['0'] }},
 {{ Guest_Count.data.LastYear['0'] }},
 {{ Guest_Count.data.TwoYearsAgo['0'] }},
 {{ Guest_Count.data.ThreeYearsAgo['0'] }},
 {{ Guest_Count.data.FourYearsAgo['0'] }},
 {{ Guest_Count.data.FiveYearsAgo['0'] }},
],
     "Spend / Head":
  [
   {{All_Locations.data.Today['0']/Guest_Count.data.Today['0']}},
   {{All_Locations.data.LastYear['0']/Guest_Count.data.LastYear['0']}},
   {{All_Locations.data.TwoYearsAgo['0']/Guest_Count.data.TwoYearsAgo['0']}},
   {{All_Locations.data.ThreeYearsAgo['0']/Guest_Count.data.ThreeYearsAgo['0']}},
   {{All_Locations.data.FourYearsAgo['0']/Guest_Count.data.FourYearsAgo['0']}},
    {{All_Locations.data.FiveYearsAgo['0']/Guest_Count.data.FiveYearsAgo['0']}},
],
}
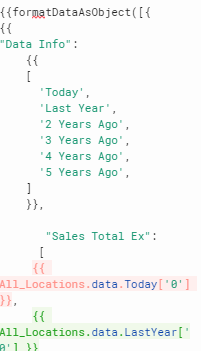
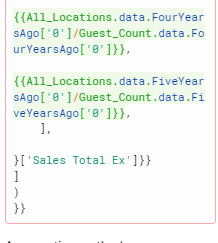
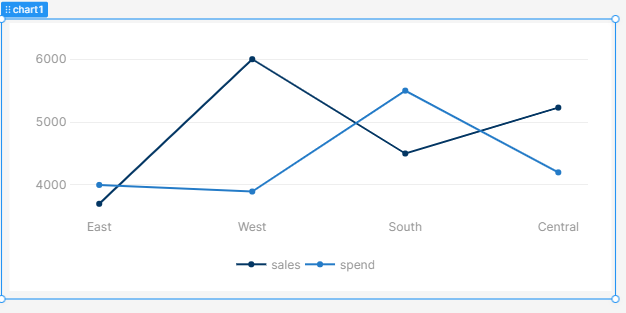
I Tried looking at the sample line chart and noticed that the data set had a section at the top stating formatDataAsObject so i tried adding that to the start of my data set and closed it off at the bottom but can't quite see why it won't work.
Trying to achieve the same as the sample chart with the years at the bottom and the data sets from left to right
As always, thanks for the help!
Cheers