<html>
<body>
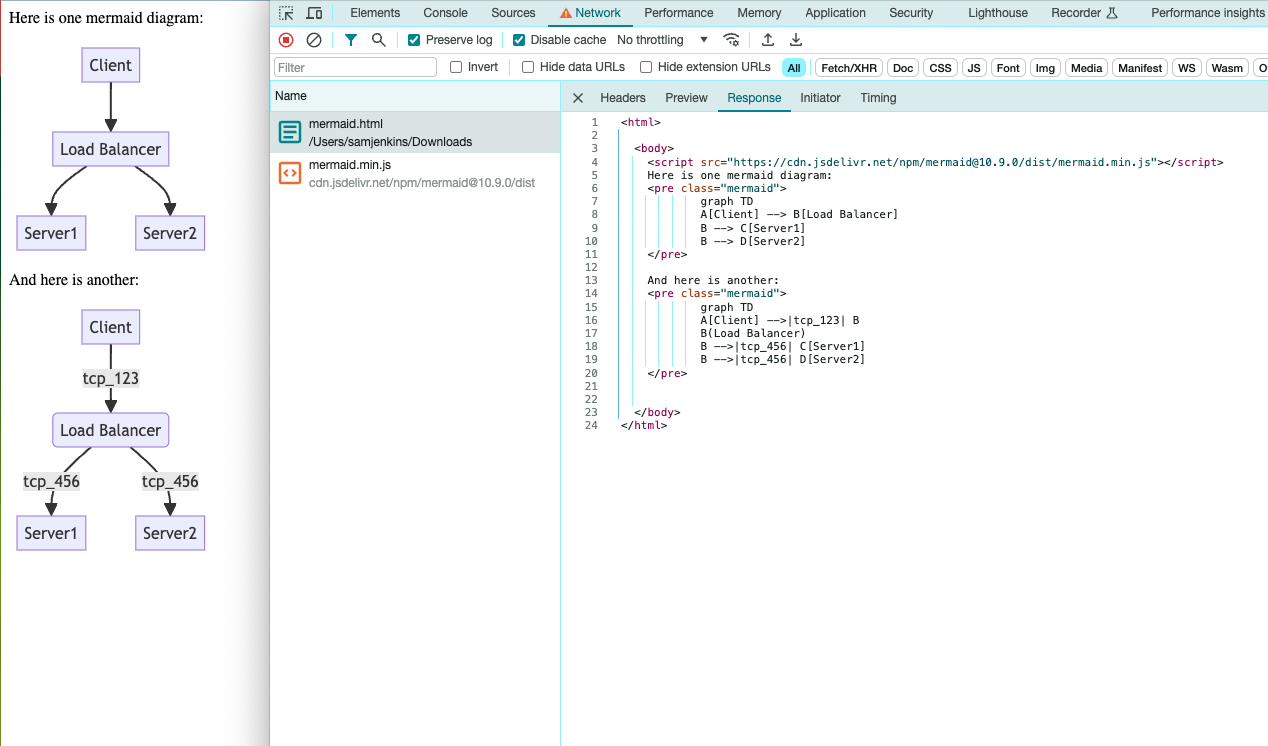
<script src="https://cdn.jsdelivr.net/npm/mermaid@10.9.0/dist/mermaid.min.js"></script>
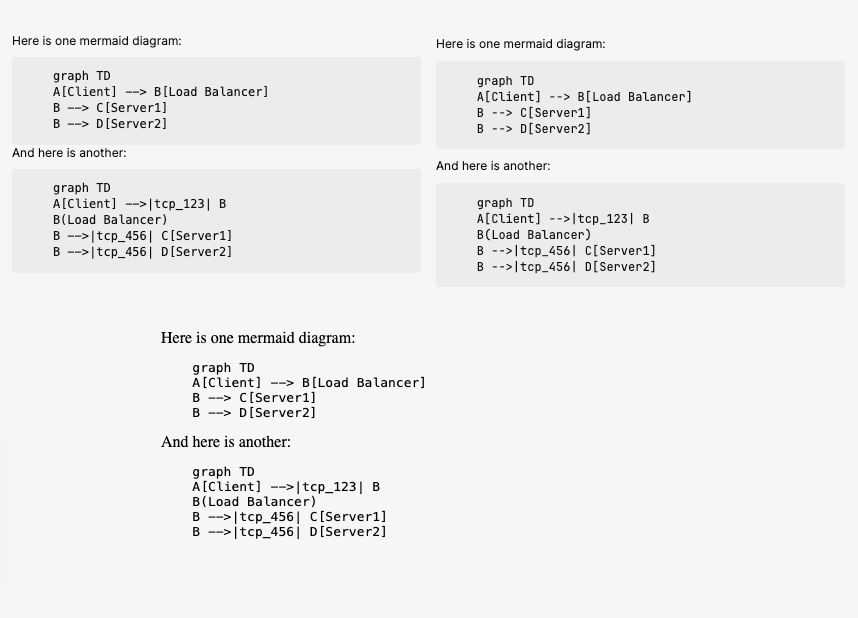
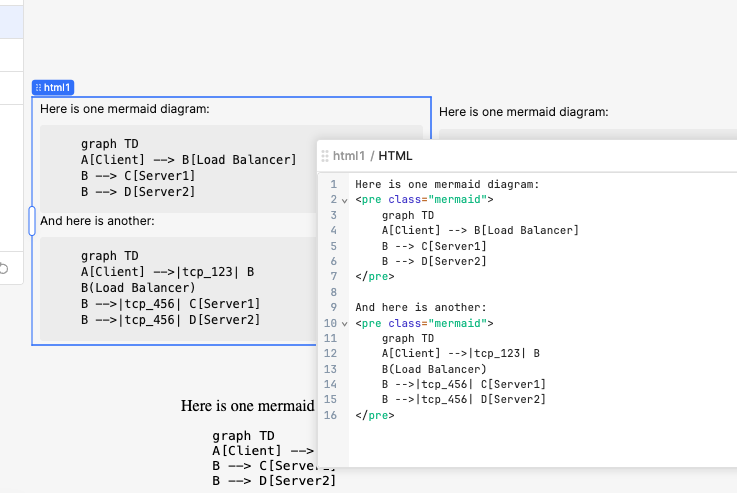
Here is one mermaid diagram:
<pre class="mermaid">
graph TD
A[Client] --> B[Load Balancer]
B --> C[Server1]
B --> D[Server2]
</pre>
And here is another:
<pre class="mermaid">
graph TD
A[Client] -->|tcp_123| B
B(Load Balancer)
B -->|tcp_456| C[Server1]
B -->|tcp_456| D[Server2]
</pre>
</body>
</html>
I highly advise taking a look at our documentation on JS libraries if you aren't familiar with it. Unfortunately, there's not an easy way to check if any given library is supported.
Here are some points to keep in mind:
JS libraries typically need to have a umd build to work in retool
The library has require statements
One way to troubleshoot is to look at browser console errors!
I am trying to render a mermaid diagram in a column of each row of a table using the HTML format option for the column def. That format seems to strip out script tags, so embedding the mermaid lib in the cell's string value is a bust.
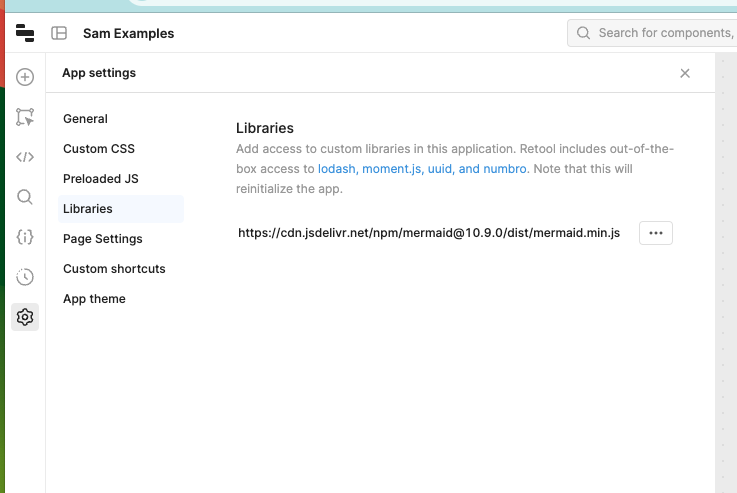
I've also tried importing the mermaid library at the app settings level, but when rendering the app page it seems that the mermaid library is not actually imported (ie "mermaid" does not appear anywhere in the page source). If I could import it, I might be able to initialize/invoke mermaid using some code in "Preloaded JS"
Do you have any suggestions for how to achieve rendering a graph in each row of a table?
you cannot "create" interface elements via js in the html column type, the only viable solution is by using an external service (such as an API-like-URL) that outputs an SVG source, thus, you can use it as image.
for the same reason, you cannot use Mermaid library anywhere in Retool because it "creates" an interface element, the js-anywhere in Retool if for data manipulation only. Thus, importing it via Preloaded JS won't work in any case.
the only way you can use Mermaid library at runtime is through a Custom Component.
This is a legacy component that is no longer supported.
...
You can also use an IFrame component.
Can an iFrame be used in a table cell, and can an iFrame import mermaid library in the usual way mermaid is used? If so, could you point me to an example that uses an iFrame in a table cell, and what the cell data (which comes from a database query, which can return an arbitrarily complex string)?
In any case, an iframe wouldn't be enough because you still need to pass some data in order to generate a diagram that you want to be different for each table row. An iframe would only allow rendering a fixed diagram, the same for each row, without any possibility to parameterize it.
In any case, neither the iframe nor the custom component is available in the table column type.
The only option you have is the one described in my previous answer.
It might be a route but you have to solve also the DOM API dependency of Mermaid library (which is heavily used for element positions calculation), DOM that is not available in Workflows, but it might work with some Node implementations, who knows.
I think your first post is a pretty concrete solution to the stated problem, @abusedmedia! Thanks for pitching in.
If you haven't already, @Glen, I recommend enabling expandable rows on your table. This would allow you to utilize custom components or, realistically, any other Retool component.
@Darren, thanks for the suggestion, but expandable rows doesn't deliver what I have in mind.
I'm exploring raw svg rather than having mermaid generate it (but can't get it to work).
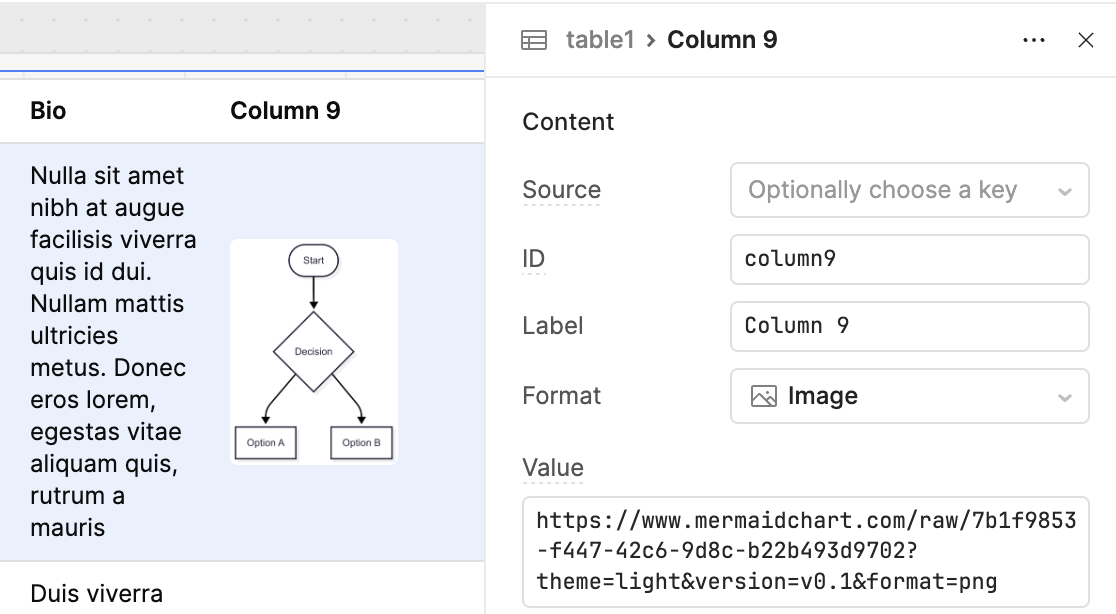
Ah got it - I didn't catch the fact that you want to render the graph in a single cell. I've done some additional testing and it doesn't look like a column of type Image is able to render a diagram exported from Mermaid as an SVG. It does work when exporting as a PNG, though.
@Darren I have a postgres DB serving the data, which can return text in a column, which I would like to have rendered as a graph etc, ideally rendered by mermaid. I've tried every combination I can think of including return raw svg in an <svg> tag (including within a body tag in an html tag), and setting the type to HTML, Image and Markdown (using mermaid markdown), but no luck.
Interestingly, when I try HTML format view page source, I don't see "svg". Could you give me a working example of rendering svg within a cell of a table?
btw, the intuitive way would be to include mermaid.js as an imported library under settings, but apparently it's not on the "blessed" list of libraries - can mermaid be allowed (IMHO mermaid is very cool and would improve Retool's functionality)?
@abusedmedia Thank you; it works!
For anyone pulling their data from Postgres, I was able to write an SQL query with a series of CTEs that returns base 64 encoded svg to plot a line graph by using string_agg to collect the points, then select '<svg height="230" width="600" xmlns="http://www.w3.org/2000/svg"><style>text { font-family: Arial, sans-serif; font-size: 12px; dominant-baseline: middle; text-anchor: middle; } </style><polyline points="' || plot_points || '" style="fill:none;stroke-width:4" /></svg>' then 'data:image/svg+xml;base64,' || encode(my_svg::bytea, 'base64') and using dynamic row height for the table.