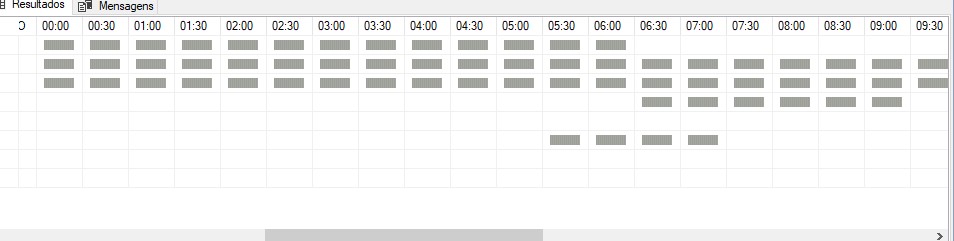
is there a way to create a graphic like this in retool?
data:
[
{
"SCRIPT": "FIN_PLAN_CONFIRMING",
"x": "00:00",
"y": "06:29"
},
{
"SCRIPT": "FIN_LANCTO_NF_WRITER",
"x": "00:00",
"y": "00:00"
},
{
"SCRIPT": "FISCAL_EXPORT_XML_SAP",
"x": "00:00",
"y": "00:00"
},
{
"SCRIPT": "FISCAL_LANCTO_NF_PRODUTOR_RURAL",
"x": "06:30",
"y": "08:29"
},
{
"SCRIPT": "FIN_IMP_ARQ_RETORNO_CNAB",
"x": "05:30",
"y": "07:29"
},
{
"SCRIPT": "PRICING_DERRUBA_PRECO_OFERTA",
"x": "08:30",
"y": "09:59"
},
{
"SCRIPT": "PRICING_OFERTA_FORA_DE_LINHA",
"x": "10:00",
"y": "17:59"
},
{
"SCRIPT": "FISCAL_LANCTO_NF_SERVICO",
"x": "11:00",
"y": "13:29"
},
{
"SCRIPT": "PRICING_ALTERA_PRECO_OFERTA",
"x": "18:00",
"y": "23:59"
}
]
Custom control is probably your best bet.
My first guess as to how to do this would be to make a table with as many rows/columns as you would need (hopefully your rows count is constant). Put your times in the table's <th>.
You then have a JS function in the control that iterates over your data and decide which cell gets filled in and set its backgroundColor or innerHTML or whatever.
I think the way to get your data into the control would be to set a variable in your script like this:
<script>
  localDataCopy={{myQuery.data}}

    function makeGrid() {
    // Do your stuff here
    var myTable = document.getElementById('myTable');
    myTable.rows[0].cells[1].innerHTML = "whatever";
    myTable.rows[0].cells[1].style.backgroundColor = "gray"

  }

  document.getElementById("makeGrid").addEventListener("click",    makeGrid);

</script>

<html>
  <body>
    <button id="makeGrid" type="button">Make Grid</button>
    <table id='myTable'>
      <!-- Table here
    </table>
  </body>
</html>