Hi everybody !
I'm trying to developp a new personnal app and i'm a bit stuck...
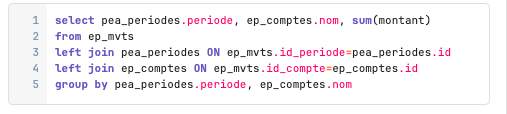
I have a SQL request :
Wich give me this result :
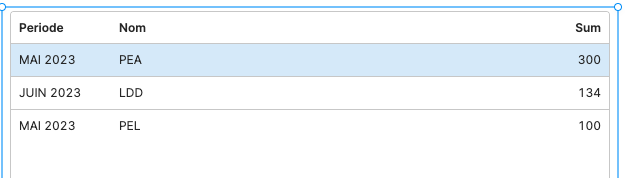
It's the sum of financial movements by account and by periods.
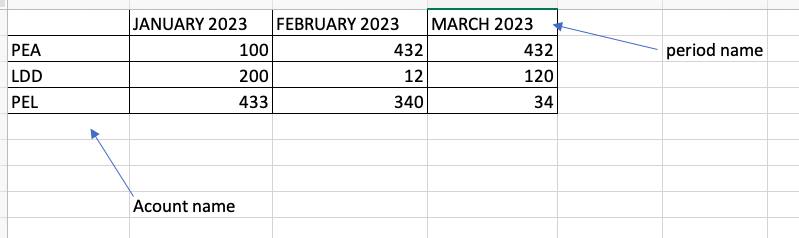
I'm trying to display datas like this :
I checked the tables components (new and legacy), also see on this forum and on google, but still stuck.
Does anyone has an idea ?
Thanks 
Hey @Thibault_COLLIN!
What kind of SQL database are you using? And how are the periods determined?
I'm not sure what the best way to do this would be, there are some ideas here but I imagine it depends largely on the SQL syntax you're using.
If you're up for exploring some complex JavaScript with the lodash library it looks like the following might work as a query transformer if you drop the group by clause from your SQL query:
const dataArray = formatDataAsArray(data);
const groupedData = _.groupBy(dataArray, "account");
return _.map(groupedData, (amounts, account) => ({account, ..._.zipObject(_.map(amounts, "month"), _.map(amounts, "amount"))}))

(Note the screenshot above doesn't include formatDataAsArray because it's a Query JSON with SQL query, you'd want to make sure it's there).