I was trying to edit query and it is showing syntax errors. I used chatgpt too,
I want to make it responsive by making changes in chart, table by a click in date range.
Hi, welcome to the forum
There was a similar question recently, this might give you some pointers - otherwise you may want to share your query code and the error message so we can help guide you in the right direction.


Can you explain what you're wanting to achieve with the dateRangePicker?
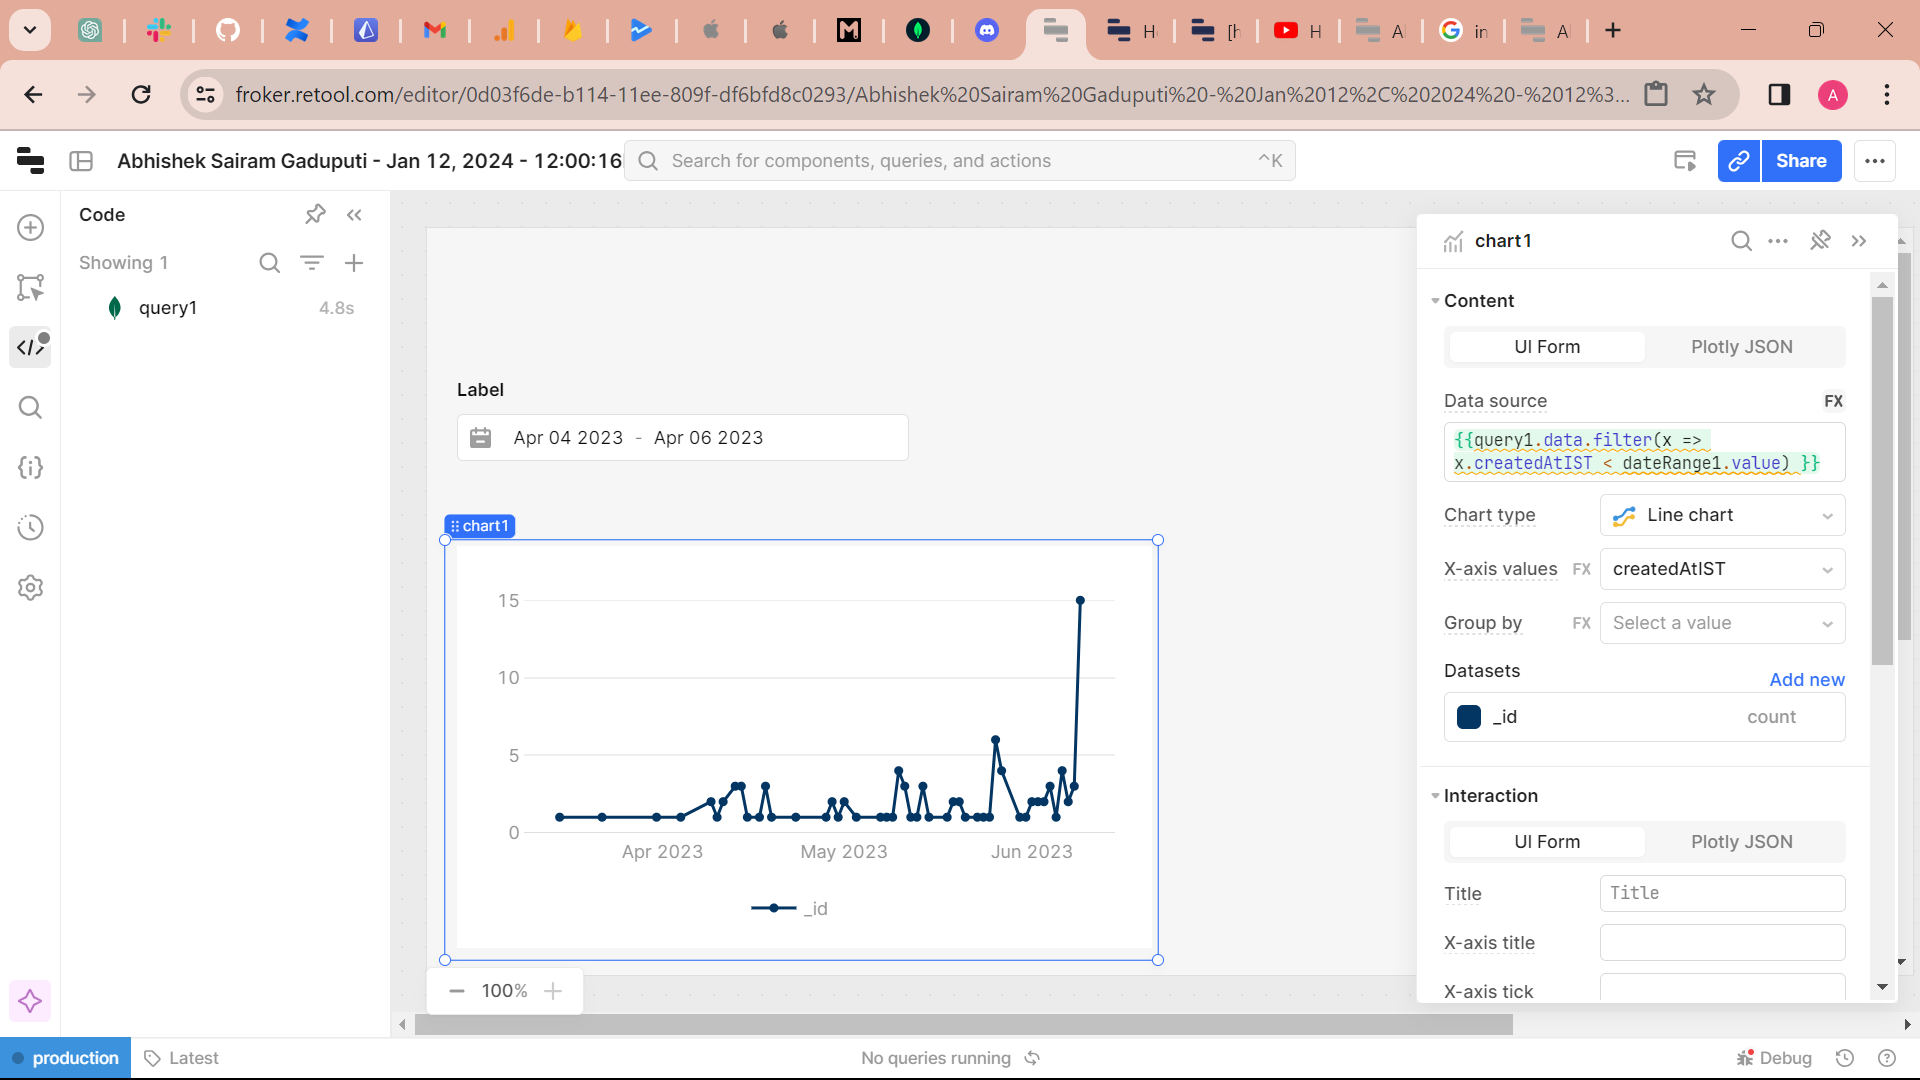
It appears you're setting it's value to a value from your query, but that could be one of many values - I would suggest you might want to leave that dateRangePicker start value empty for now
I'm not sure from the data what your chart is supposed to be showing.
Does the chart display if you remove the filter from the data source query?
If so, does the filter work if you select a value in the dateRangePicker?
If not, what error do you get or what does the chart show?
Actually in my chart i wanted to display users vs created date (signup date), now user want to filter this chart by date range from ddmmyyyy to ddmmyyyy and display that in chart.
i can see chart but im unable to filter date,
i'm sorry sir, i started to use retool from past 2 days so i was not familiar.
please do help me!!
we all start somewhere, good to see how much progress you've already made in 2 days
If you take a look at the dateRangePicker the value it provides has 2 properties, a start and end date. In you data source you're referencing the value not the start or end.
ie you may need to change dateRange1.value to dateRange1.value.start
1 Like
Thankyou!!