How do you do a general debugging in custom components? I'm trying to import a library and I'm using the simplest code that I can find with that library but it's still a blank component and I'm not sure how I would debug it.
I'm aware of the debug tools on the bottom right but I'm not sure what information that I can get from that since this is just HTML.
This is the code that I have in the iframe:
<script
  src="https://unpkg.com/react@18/umd/react.development.js"
  crossorigin
></script>
<script
  src="https://unpkg.com/react-dom@18/umd/react-dom.development.js"
  crossorigin
></script>
<script
  src="https://cdnjs.cloudflare.com/ajax/libs/react-flow-renderer/10.3.17/esm/index-20df97c0.min.js"
  crossorigin
></script>
<div id="react"></div>
<script>
  const initialNodes = [
  { id: '1', position: { x: 0, y: 0 }, data: { label: '1' } },
  { id: '2', position: { x: 0, y: 100 }, data: { label: '2' } },
  ];
  const initialEdges = [{ id: 'e1-2', source: '1', target: '2' }];

  const MyCustomComponent = ({ triggerQuery, model, modelUpdate }) => (
    <p>Hello, {model.name}!</p>
    <div>
      <ReactFlow nodes={initialNodes} edges={initialEdges} />
    </div>
  );

  const ConnectedComponent = Retool.connectReactComponent(MyCustomComponent);
  const container = document.getElementById("react");
  const root = ReactDOM.createRoot(container);
  root.render(<ConnectedComponent />);
</script>
But it keeps appearing as blank because something is wrong. All I want is to learn how to debug this so wondering what other people would do.
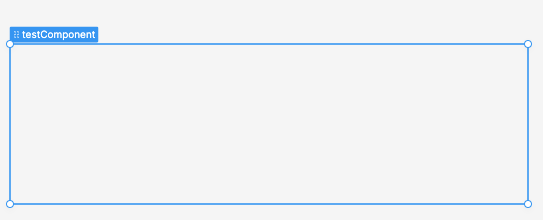
This is what I see on the edit mode