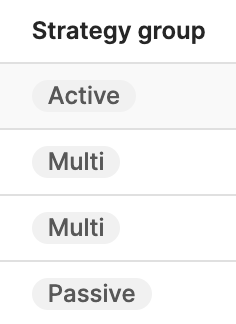
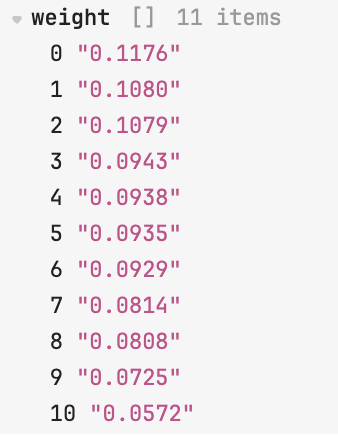
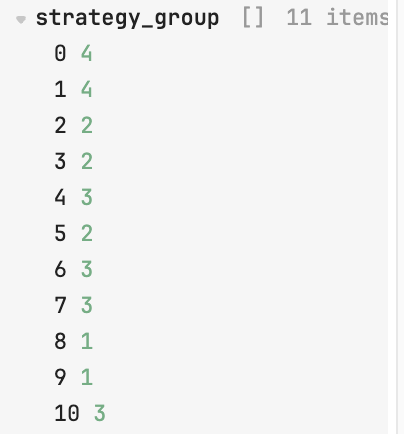
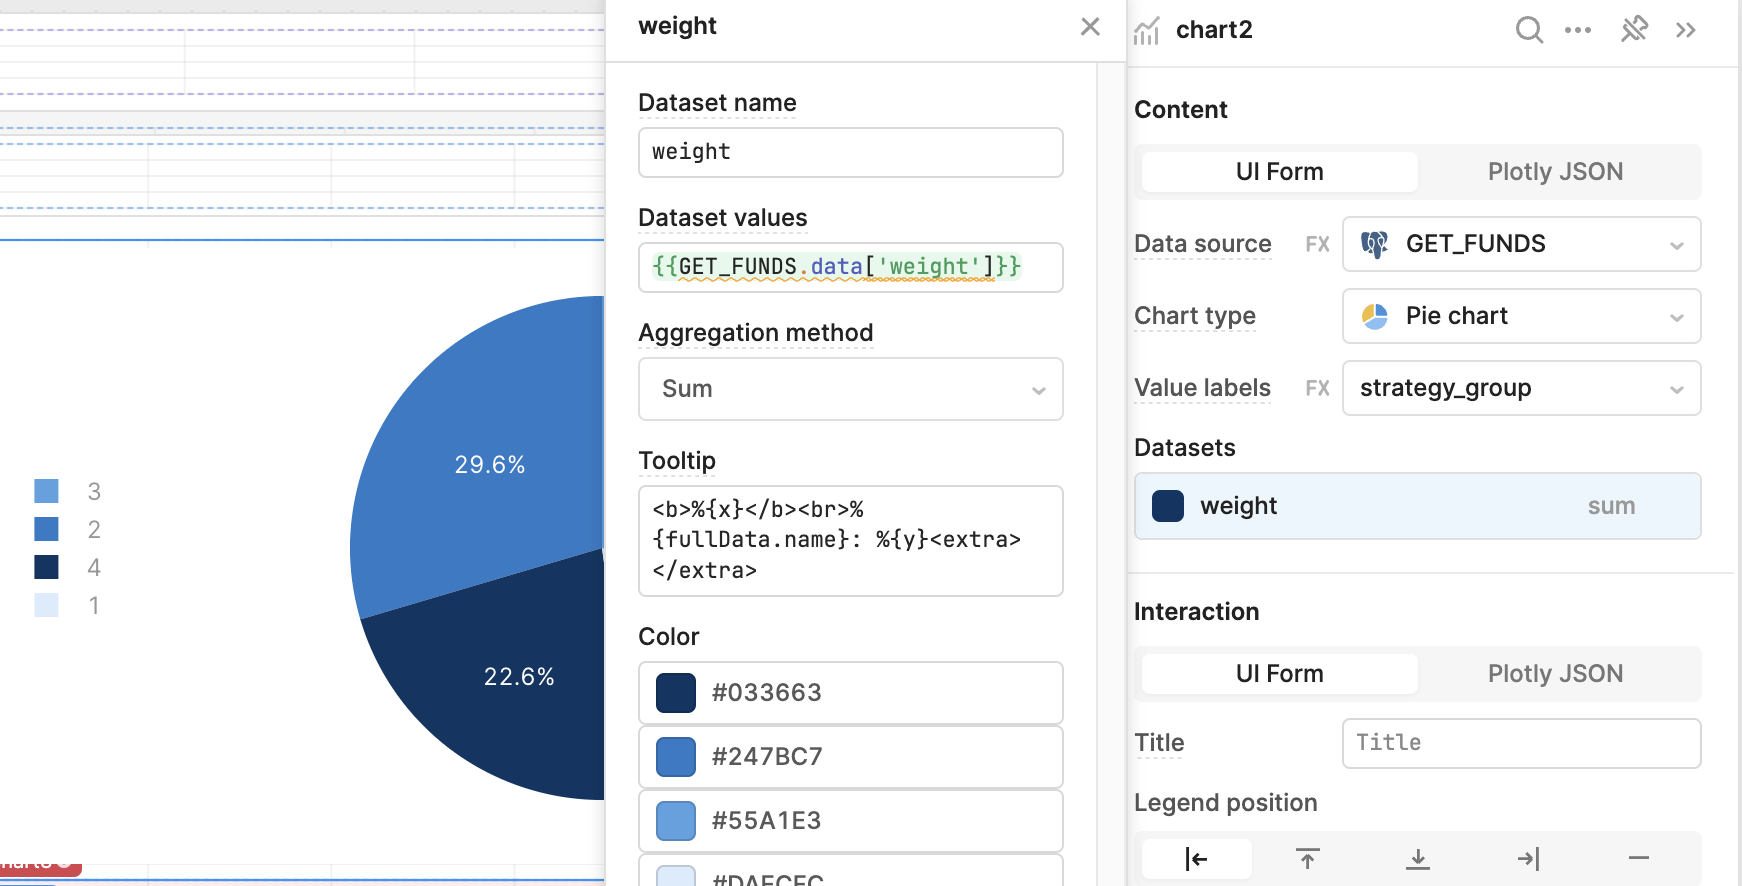
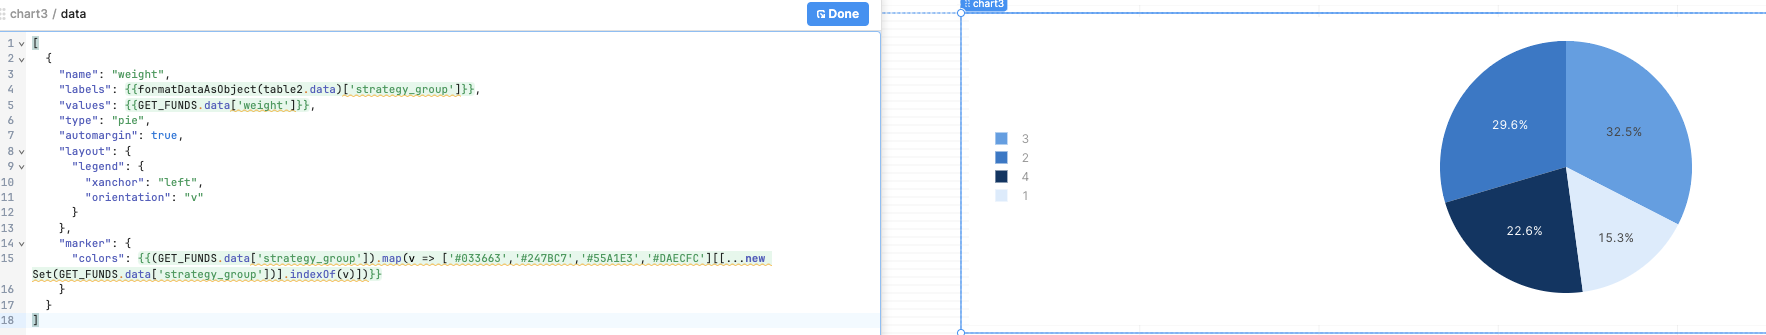
I have set up a table in Retool with two columns: strategy_group and weight. In the strategy_group column, the original data consists of IDs, but I have utilized the mapped value feature within the column settings to display corresponding descriptive names instead of these IDs. Now, I am trying to create a pie chart which reflects the sum of weights, with the value labels displayed as the descriptive names from the strategy_group column.
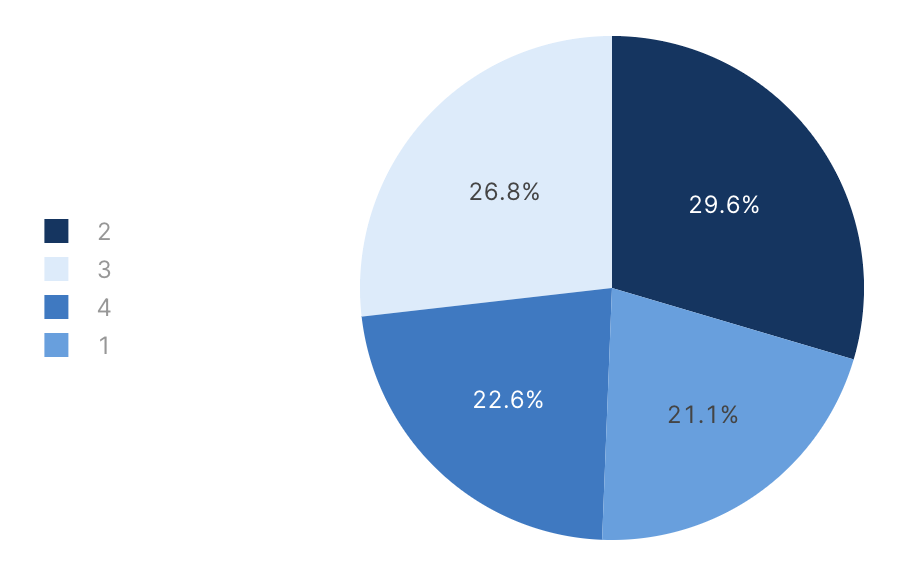
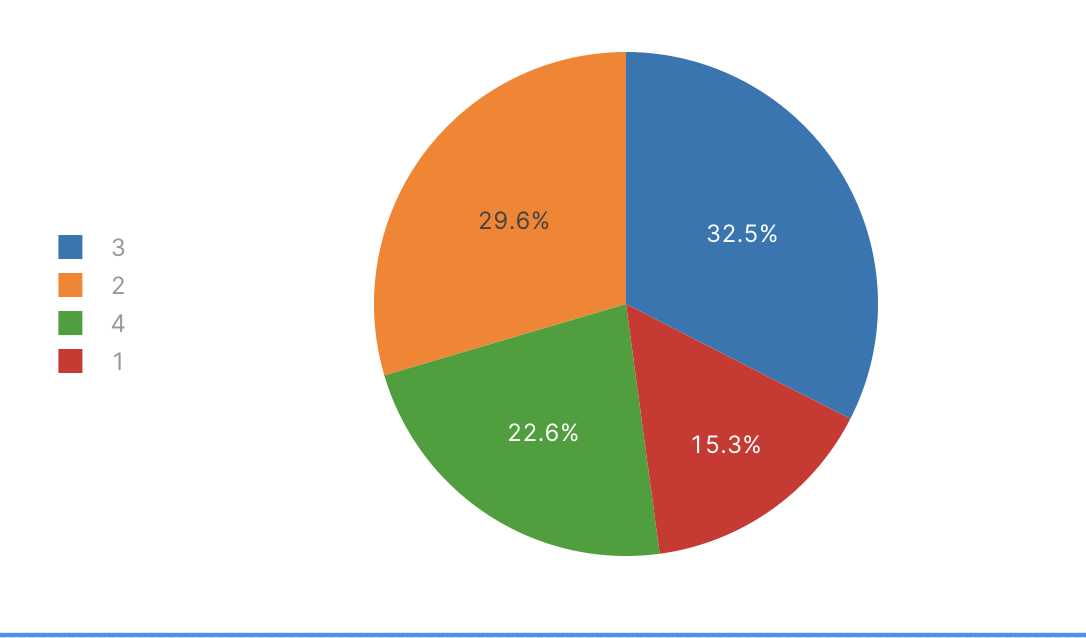
However, the pie chart currently shows the original ID values (e.g., 1,2,3,4) in the labels instead of the mapped descriptive names. Could someone guide me on how to configure the pie chart to display the mapped values from the strategy_group column as the labels?
Any help would be much appreciated. Thank you in advance!
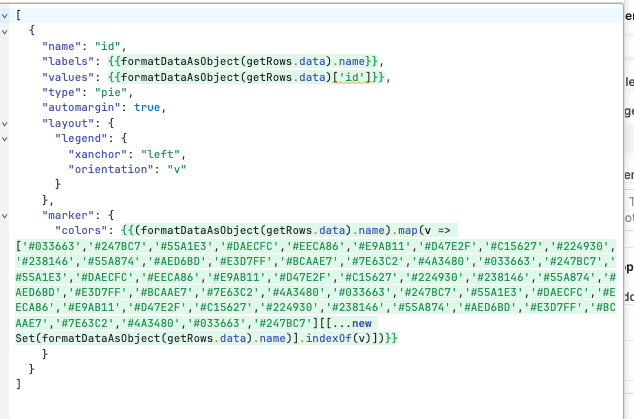
That makes sense so you may have to take the mapped value instead by transforming the data for that column. I will try to get back to this as soon as I can but cannot at the moment