Hi @rai_umad thanks for your question and welcome to the Retool commuity!
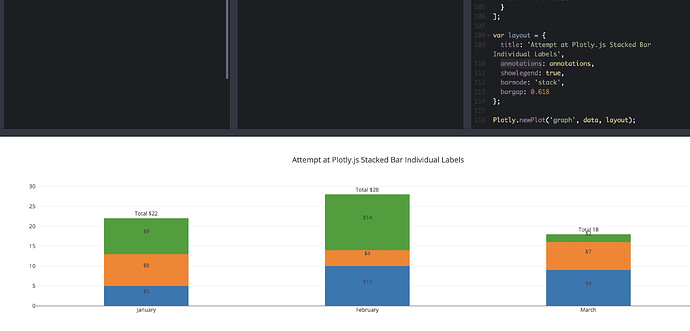
It looks like you can supply an annotations array in the layout JSON to add the labels for group of stacked bars. Here's an example I found on codepen as well as a reference in Plotly's docs.
Let me know if this works!
An example of how the resulting layout JSON could look something like this in Retool:
{
  "title": "Attempt at Plotly.js Stacked Bar Individual Labels",
  "annotations": [
    {
      "x": "January",
      "y": "5/2",
      "text": "$5",
      "xanchor": "center",
      "yanchor": "bottom",
      "showarrow": false
    },
    {
      "x": "January",
      "y": "5+(8/2)",
      "text": "$8",
      "xanchor": "center",
      "yanchor": "bottom",
      "showarrow": false
    },
    {
      "x": "January",
      "y": "5+8+(9/2)",
      "text": "$9",
      "xanchor": "center",
      "yanchor": "bottom",
      "showarrow": false
    },
    {
      "x": "January",
      "y": "5+8+9",
      "text": "Total $22",
      "xanchor": "center",
      "yanchor": "bottom",
      "showarrow": false
    },
    {
      "x": "February",
      "y": "10/2",
      "text": "$10",
      "xanchor": "center",
      "yanchor": "bottom",
      "showarrow": false
    },
    {
      "x": "February",
      "y": "10+(4/2)",
      "text": "$4",
      "xanchor": "center",
      "yanchor": "bottom",
      "showarrow": false
    },
    {
      "x": "February",
      "y": "10+4+(14/2)",
      "text": "$14",
      "xanchor": "center",
      "yanchor": "bottom",
      "showarrow": false
    },
    {
      "x": "February",
      "y": "10+4+14",
      "text": "Total $28",
      "xanchor": "center",
      "yanchor": "bottom",
      "showarrow": false
    }
  ],
  "showlegend": true,
  "barmode": "stack",
  "bargap": 0.618
}


