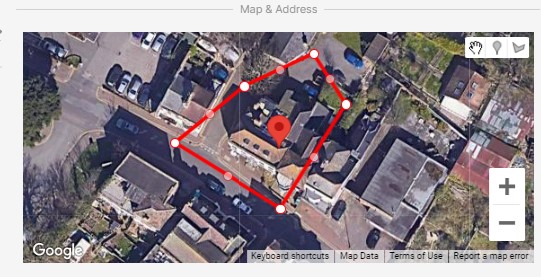
Hello, sorry to bump but thought I would share what I have been looking at and rebuilding the google map using a the new custom react component using vis.gl and google maps examples via Retool.useStateString. The javascript map had lots of issues with updating the site boundary.
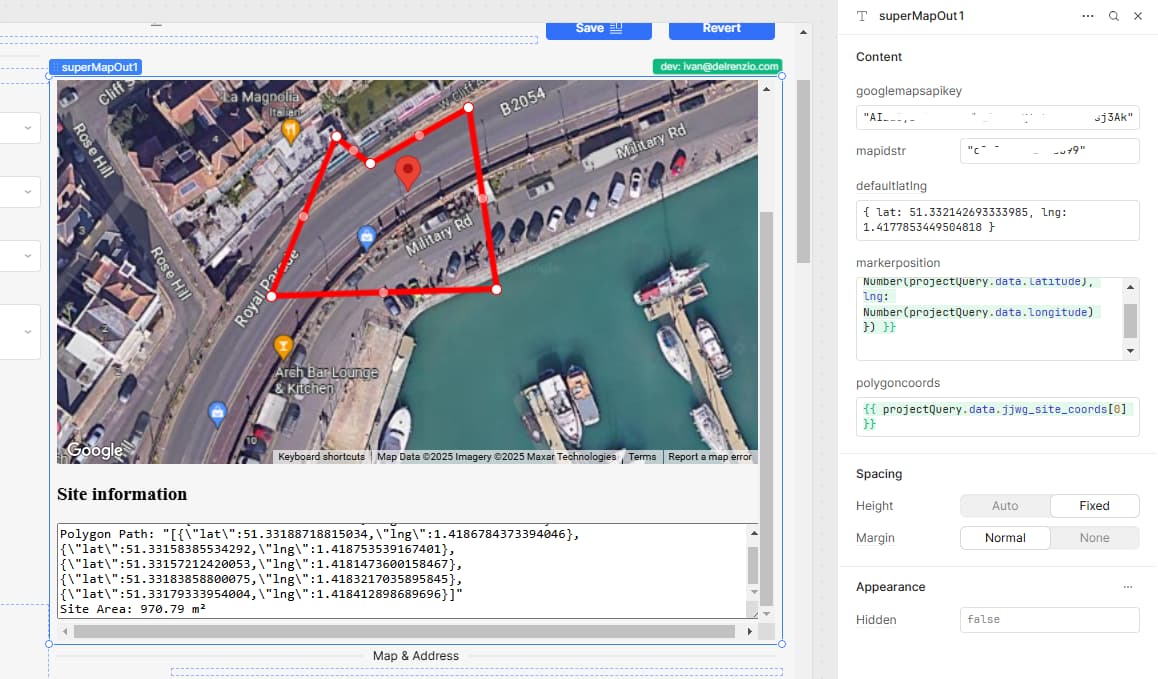
The component has 5 inputs.
The following typescript modules are required:
index.tsx:
import { APIProvider } from "@vis.gl/react-google-maps";
import Supermap from "./supermap";
import { Retool } from "@tryretool/custom-component-support";


export const SuperMapOut: React.FC = () => {
    const [apiKey] = Retool.useStateString({ name: "googlemapsapikey" });

    if (!apiKey) {
        console.error("Missing Google Maps API Key!");
        return <div style={{ color: "red" }}>Google Maps API Key is missing!</div>;
    }

    return (
        <APIProvider apiKey={apiKey} libraries={["marker", "places"]}>
            <Supermap/>
        </APIProvider>
    );
};

export default SuperMapOut;
polygon.tsx
import {
    forwardRef,
    useContext,
    useEffect,
    useImperativeHandle,
    useRef
} from 'react';

import { GoogleMapsContext } from '@vis.gl/react-google-maps';

import type { Ref } from 'react';

type PolygonEventProps = {
    onEdit?: (newPath: google.maps.LatLngLiteral[]) => void;
    onDelete?: () => void; // Handle external deletion
};

type PolygonCustomProps = {
    paths: google.maps.LatLngLiteral[] | null;
};

export type PolygonProps = google.maps.PolygonOptions & PolygonEventProps & PolygonCustomProps;

export type PolygonRef = Ref<google.maps.Polygon | null>;

function usePolygon(props: PolygonProps) {
    const { onEdit, onDelete, paths, ...polygonOptions } = props;
    const polygonRef = useRef<google.maps.Polygon | null>(null);

    const map = useContext(GoogleMapsContext)?.map;

    useEffect(() => {
        if (!map) {
            console.error('<Polygon> must be inside a Map component.');
            return;
        }

        if (polygonRef.current) {
            polygonRef.current.setMap(null); // Remove old polygon before creating a new one
        }

        if (!paths) {
            if (polygonRef.current) {
                polygonRef.current.setMap(null);
                polygonRef.current = null;
            }
            return;
        }

        polygonRef.current = new google.maps.Polygon({
            ...polygonOptions,
            paths: paths || [],
            editable: true, // Ensure polygon is editable
            draggable: true
        });

        polygonRef.current.setMap(map);

        const path = polygonRef.current.getPath();
        if (path) {
            const updatePolygon = () => {
                if (onEdit && polygonRef.current) {
                    const newPath = polygonRef.current.getPath().getArray().map(latlng => latlng.toJSON());
                    onEdit(newPath);
                }
            };

            google.maps.event.addListener(path, 'set_at', updatePolygon);
            google.maps.event.addListener(path, 'insert_at', updatePolygon);
            google.maps.event.addListener(path, 'remove_at', updatePolygon);
        }

        return () => {
            if (polygonRef.current) {
                polygonRef.current.setMap(null);
            }
        };
    }, [map, paths, polygonOptions, onEdit]);

    return polygonRef.current;
}

export const Polygon = forwardRef((props: PolygonProps, ref: PolygonRef) => {
    const polygon = usePolygon(props);

    useImperativeHandle(ref, () => polygon, []);

    return null;
});
use-drawing-manager.tsx
import { useMap, useMapsLibrary } from '@vis.gl/react-google-maps';
import { useEffect, useState } from 'react';

export function useDrawingManager(
    initialValue: google.maps.drawing.DrawingManager | null = null,
    onMarkerPlaced?: (position: google.maps.LatLngLiteral) => void,
    onPolygonDrawn?: (path: google.maps.LatLngLiteral[]) => void,
    isMarkerToolDisabled?: boolean,
    isPolygonToolDisabled?: boolean
) {
  const map = useMap();
  const drawing = useMapsLibrary('drawing');

  const [drawingManager, setDrawingManager] = useState<google.maps.drawing.DrawingManager | null>(initialValue);
  const [polygonExists, setPolygonExists] = useState(false); // Track polygon presence

  useEffect(() => {
    if (!map || !drawing) return;

    const newDrawingManager = new drawing.DrawingManager({
      map,
      drawingMode: null, // Start with no active tool
      drawingControl: true,
      drawingControlOptions: {
        position: google.maps.ControlPosition.TOP_CENTER,
        drawingModes: [
          ...(isMarkerToolDisabled ? [] : [google.maps.drawing.OverlayType.MARKER]),
          ...(isPolygonToolDisabled ? [] : [google.maps.drawing.OverlayType.POLYGON])
        ],
      },
      markerOptions: {
        draggable: true,
      },
    });

    google.maps.event.addListener(newDrawingManager, 'overlaycomplete', (event: google.maps.drawing.OverlayCompleteEvent) => {
      if (event.type === google.maps.drawing.OverlayType.MARKER) {
        if (isMarkerToolDisabled) return; // Prevent multiple markers

        const marker = event.overlay as google.maps.Marker;
        const position = marker.getPosition()?.toJSON();

        if (position) {
          onMarkerPlaced?.(position);
        }

        event.overlay.setMap(null); // Remove overlay (we use AdvancedMarker)
      }

      if (event.type === google.maps.drawing.OverlayType.POLYGON) {
        if (isPolygonToolDisabled) return; // Prevent multiple polygons

        const polygon = event.overlay as google.maps.Polygon;
        const path = polygon.getPath().getArray().map(latlng => latlng.toJSON());

        onPolygonDrawn?.(path);
        setPolygonExists(true);

        polygon.setMap(null); // Remove overlay (we use our own Polygon component)
      }
    });

    setDrawingManager(newDrawingManager);

    return () => {
      newDrawingManager.setMap(null);
    };
  }, [drawing, map, isMarkerToolDisabled, isPolygonToolDisabled]);

  // Function to reset the polygon state when deleted
  const resetPolygon = () => {
    setPolygonExists(false);
  };

  return { drawingManager, polygonExists, setPolygonExists, resetPolygon };
}
supermap.tsx
import React, { useEffect, useState } from 'react';
import { ControlPosition, Map, MapControl, AdvancedMarker, useMapsLibrary, useMap } from '@vis.gl/react-google-maps';
import { useDrawingManager } from './use-drawing-manager';
import { Polygon } from './polygon';
import { Retool } from "@tryretool/custom-component-support";

type LatLng = {
    lat: number;
    lng: number;
};


const Supermap = () => {
    const mapRef = useMap();
    const [mapIdStr] =  Retool.useStateString({name:"mapidstr"});
    const [latLng, setLatLng] = Retool.useStateString({name:"defaultlatlng",description:"Use a google latLng JSON e.g.: { lat: 51.332142693333985, lng: 1.4177853449504818 }"});
    //const [latLng, setLatLng] = useState<LatLng>({ lat: 51.332142693333985, lng: 1.4177853449504818 });
    const [markerPosition, setMarkerPosition] = Retool.useStateString({name: "markerposition", initialValue: '{ "lat": 51.332142693333985, "lng": 1.4177853449504818 }'});
    const [polygonCoords, setPolygonPath] = Retool.useStateString({name: "polygoncoords"});
    const [isPolygonToolDisabled, setIsPolygonToolDisabled] = useState(false);
    const [isHover, setIsHover] = useState(false);
    const [zoom, setZoom] = useState(19); // not used yet but will possible save the zoom state to the DB.
    const handleMouseEnter = () => {
        setIsHover(true);
    };
    const handleMouseLeave = () => {
        setIsHover(false);
    };
    // Parse marker position and set to null if lat:0, lng:0
    const parsedMarkerPosition = (() => {
        try {
            if (!markerPosition || markerPosition === "null") return null;
            const parsed = JSON.parse(markerPosition);
            if (typeof parsed === "object" && parsed !== null && "lat" in parsed && "lng" in parsed) {
                if (parsed.lat !== 0 || parsed.lng !== 0) {
                    mapRef?.setCenter(parsed); // Set map center only if lat/lng are valid
                }
            }

            // Ensure it's a valid object with latitude & longitude
            if (typeof parsed !== "object" || parsed === null || !("lat" in parsed) || !("lng" in parsed)) {
                return null;
            }

            return parsed.lat === 0 && parsed.lng === 0 ? null : parsed;
        } catch (error) {
            console.error("Error parsing markerPosition:", error);
            return null;
        }
    })();


    // Parse polygon coordinates and set to null if empty
    const parsedPolygonCoords = (() => {
        try {
            const parsed = JSON.parse(polygonCoords);
            return Array.isArray(parsed) && parsed.length === 0 ? null : parsed;
        } catch (error) {
            return null;
        }
    })();
    const calculatePolygonArea = (coords: string | null) => {
        if (!coords) return '0'; // Handle null or empty state safely

        let parsedCoords: google.maps.LatLngLiteral[];

        try {
            parsedCoords = JSON.parse(coords) as google.maps.LatLngLiteral[];
        } catch (error) {
            console.error('Invalid polygonCoords JSON:', error);
            return '0'; // Return 0 if parsing fails
        }

        if (parsedCoords.length < 3) return '0'; // A polygon must have at least 3 points

        let area = 0;
        const radius = 6378137; // Earth's radius in meters
        for (let i = 0; i < parsedCoords.length; i++) {
            const j = (i + 1) % parsedCoords.length;
            const lat1 = (parsedCoords[i].lat * Math.PI) / 180;
            const lng1 = (parsedCoords[i].lng * Math.PI) / 180;
            const lat2 = (parsedCoords[j].lat * Math.PI) / 180;
            const lng2 = (parsedCoords[j].lng * Math.PI) / 180;
            area += (lng2 - lng1) * (2 + Math.sin(lat1) + Math.sin(lat2));
        }

        area = Math.abs((area * radius * radius) / 2);
        return area.toFixed(2); // Keep the area formatted as a string
    };


    const { drawingManager, polygonExists, setPolygonExists, resetPolygon } = useDrawingManager(null, (position) => {
        setMarkerPosition("");
        setTimeout(() => {
            setMarkerPosition(JSON.stringify(position));
        }, 0);
    }, (path) => {
        setPolygonPath(JSON.stringify(path));
        setIsPolygonToolDisabled(true);
        setPolygonExists(true);
    }, false, isPolygonToolDisabled);

    const buttonStyle = { width: '27px', height: '27px',
        border: '1px solid rgba(0, 0, 0, 0.1)', borderRadius: '2px', display: 'flex',
        alignItems: 'center', justifyContent: 'center', cursor: 'pointer',
        marginTop: '5px', marginLeft: '-5px',
        backgroundColor: isHover ? 'rgb(235, 235, 235)':'white'}

    return (
        <>

            <Map
                defaultZoom={zoom}
                defaultCenter={parsedMarkerPosition !== null ? parsedMarkerPosition : latLng}
                gestureHandling={'greedy'}
                disableDefaultUI={true}
                mapId={mapIdStr}
                mapTypeId={'hybrid'}
            >
                <MapControl position={ControlPosition.TOP_CENTER}>
                    <button style={buttonStyle} onClick={() => {
                        setPolygonPath("");
                        setPolygonExists(false);
                        resetPolygon();
                    }} onMouseEnter={handleMouseEnter}
                            onMouseLeave={handleMouseLeave}
                            disabled={!parsedPolygonCoords} title='Delete current boundary'>
                        <svg width='36' height='36' viewBox='0 0 24 24' fill='none' xmlns='http://www.w3.org/2000/svg'>
                            <path d='M3 6h18M8 6V4a2 2 0 012-2h4a2 2 0 012 2v2m3 0v14a2 2 0 01-2 2H6a2 2 0 01-2-2V6h16zM10 11v6m4-6v6' stroke='currentColor' strokeWidth='2' strokeLinecap='round' strokeLinejoin='round'/>
                        </svg>
                    </button>
                </MapControl>
                {parsedMarkerPosition && (
                    <AdvancedMarker position={parsedMarkerPosition} draggable={true} onDragEnd={(event) => setMarkerPosition(JSON.stringify(event?.latLng?.toJSON() || null))} />
                )}
                <Polygon fillOpacity={0} strokeColor={'#FF0000'} editable={true} draggable={true} onEdit={(newPath) => setPolygonPath(JSON.stringify(newPath))} strokeWeight={6} paths={parsedPolygonCoords} />
            </Map>


            <div>
                <h3>Site information</h3>
                <textarea
                    readOnly
                    value={`Marker Position: ${markerPosition}
Polygon Path: ${JSON.stringify(polygonCoords)}
Site Area: ${polygonCoords ? calculatePolygonArea(polygonCoords) : '0'} m²`}
                    rows={6}
                    style={{ width: '100%' }}
                />
            </div>
        </>
    );
};

export default Supermap;
Use the standard way of importing the module from your editor.
Currently the map uses the database based on suitecrm sql. There is a default location starting point you can edit. There is also a text box at the bottom with lat lng coordinates and site area. These could also be hooked up to the Retool.useStateString.
You need a google maps api key as well as the new mapId which sets certain settings that can be overridden. The map also uses the new AdvancedMarker as the old Marker has been deprecated.