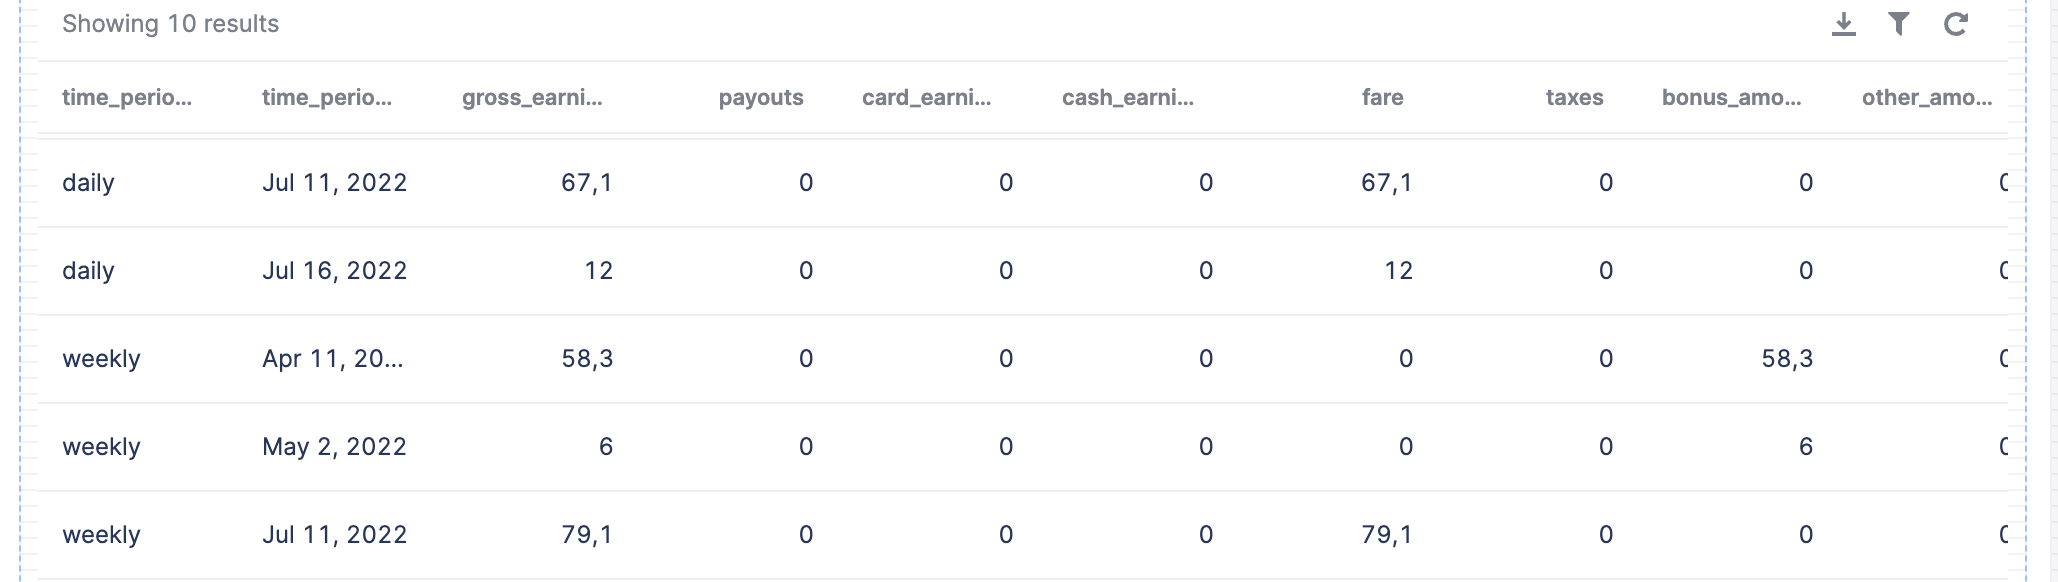
Hi all, I'm struggling a little on creating a graph from data I've got in a table. Here is the table I got from an API request:
I want to display a graph about this table, but only the data where time_period_type = "weekly" I don't know where to filter this data. I'm sure it's something not too hard. Thanks for your help.
P.
you should be able to do this with the filter function
{{yourData.data.filter(d=>d.time_period == 'weekly')}}
you could do this from a transformer or just put it directly into the data section of the chart component
Excellent! Thanks. It works perfectly! I've to work on this filtered function. I always struggle to make it work!