I am building a dashboard where I would like to see an overview of our customers when nothing is selected in the dropdown, and then be able to view metrics for a specific customer upon selecting a customer from the dropdown component.
I have done this approach for filtering before when implementing search within a table, but this doesn't seem to work the same.
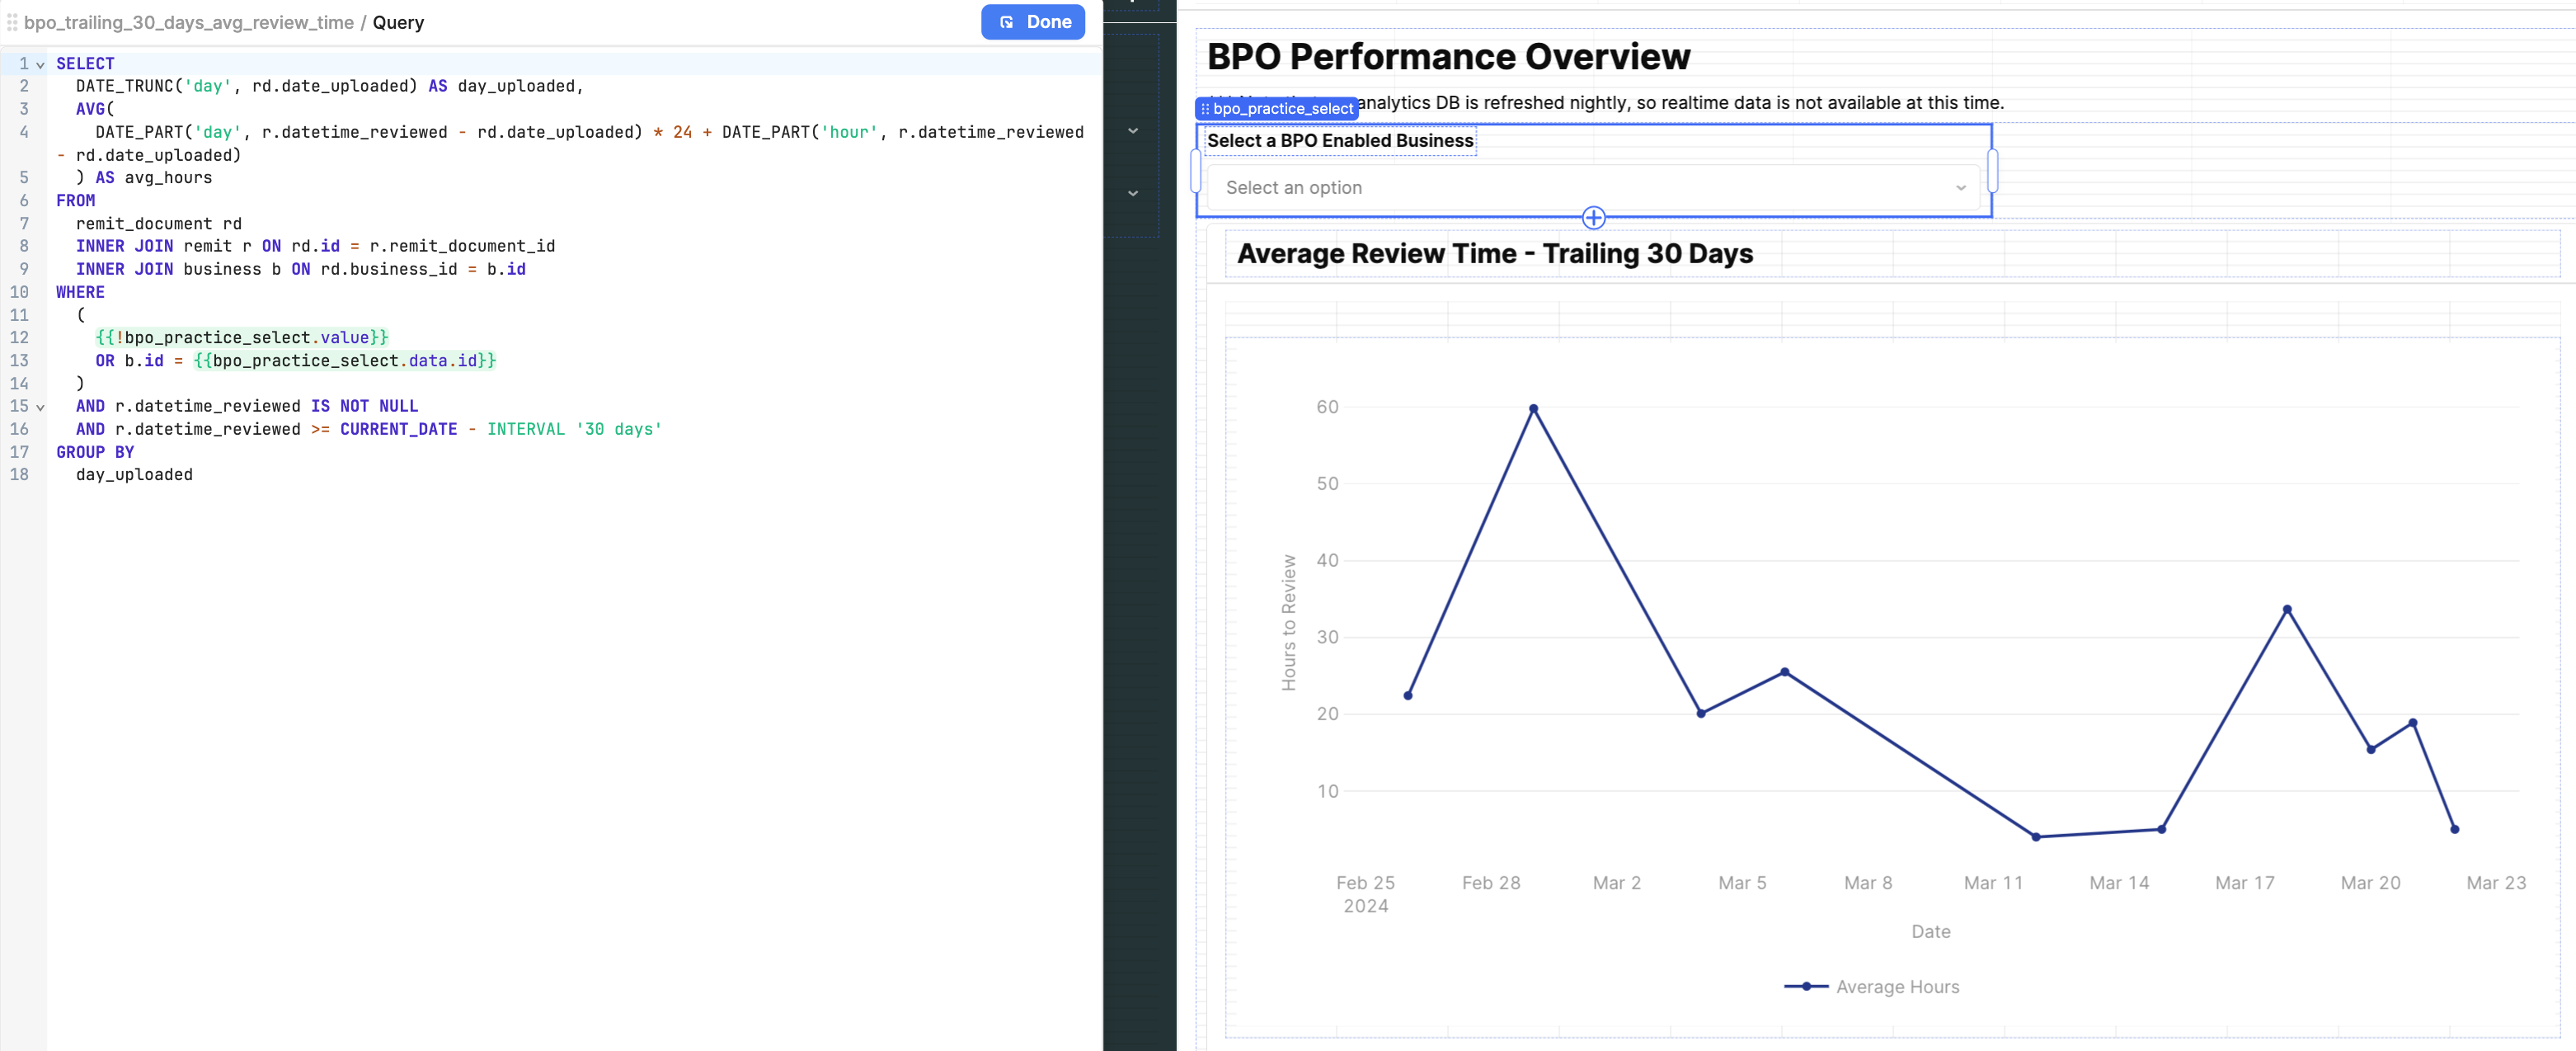
How can I make this filtering work for either a null value from the dropdown or when the ID is available? It currently displays the average review times for all customers, but I want to see the averages also after selecting a specific customer from the dropdown.
The first query in the union all is the average for all customers and doesn't reference the dropdown (and thus would always show up), and
The second query in the union all has criteria related to the drop down and no default if the drop down isn't selected.
You add some sort of label field for each of the queries, i.e., hardcode 'Average' for the first query and take the value of the dropdown for the second (or just hardcode 'Customer' if you don't show the label in the chart).
That way, your Union All Query returns just the results of the first sub-query (the "average") if nothing is selected, while returning both the queries ("average" and "customer") if the selected dropdown value matches a customer.
As long as your chart is setup to handle multiple series, you would be good to go.