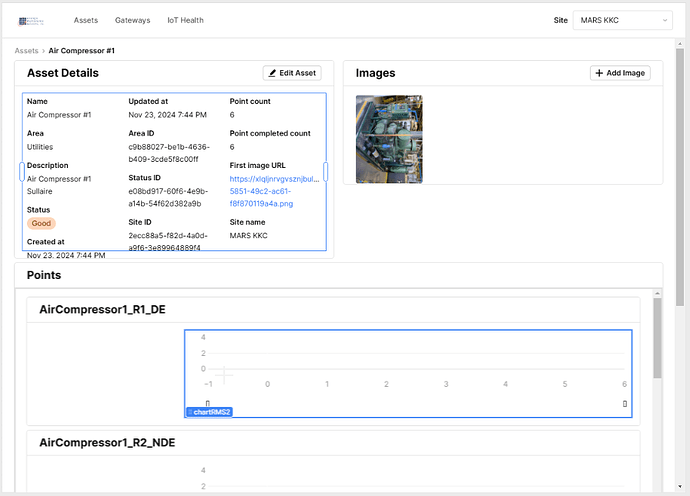
I wondered if anyone can help.
I currently have a listview that displays records from the 'points' table. Within the list view i wish to display a chart with data from the 'sensor_readings' table, showing only the readings for the point in the listview.
I am strugging to wrap my head around how i would get the data for the chart specific to each point in the list view, it would be unique rows for each repeatable in the list view. Is this even possible? I thought about using a query to capture the sensor_readings for all points in the list then filtering with a transformer but i am not aware of you being able to give the transformer parameters.
2 Likes
Hi Karman,
I am assuming based on your description that the sensor_readings table has a foreign key that relates over to your points table. Feel free to correct me if I am wrong.
I would try filtering in the chart. Something like {{ query1.data.filter(obj => obj.foreign_id === item.id )}}. item is a keyword to access the current value of the iterable we are going over in our listview.
If you have a large dataset it may make sense to transform the data from that table instead of filtering one by one as it won't be that efficient. So what you could aim for is creating a modified version of that sensor_readings query that is an object of objects with each key being the foreign key that connects to the points table. For example it could look like this:
{1: {'x': [1,2,3], 'y': [1,2,3]}, 2: {'x': [1,2,3], 'y': [1,2,3]}}
Once it is structured this way then all you would need to do is reference in the chart something like transformer1.value[item.id].x and be able to reference the related set of data by the point's id that way.
Let me know if any of that was unclear. I can demo it out further if that helps!
Hi @Kaman_Doyle, I just wanted to check in and see if you were able to get your list view working or if there was anything I could clarify on. Thanks!
