We've built an app and handed it off to our client to start entering their data.
They mentioned that as they add more data into it, it becomes slower/laggy.
In the grand scheme of things, there hasn't been that much data added, and it has been broken up amongst different tabs so it is not all being displayed at once. In addition to this, there are only a minimal amount of requests being made and updates to the UI so I don't imagine there would be any queries/functions etc, continually running which would contribute to this load.
Are there any pieces of documentation which are floating around which list some potential optimisations that can be made or best practises, just in case I am violating some 'golden rules'?
Does Retool have any 'Performance tools' or can show any metrics regarding the performance of an app?
That's good advice from @MiguelOrtiz but I find the Performance tab to be a little unhelpful at times.
I'd suggest these things:
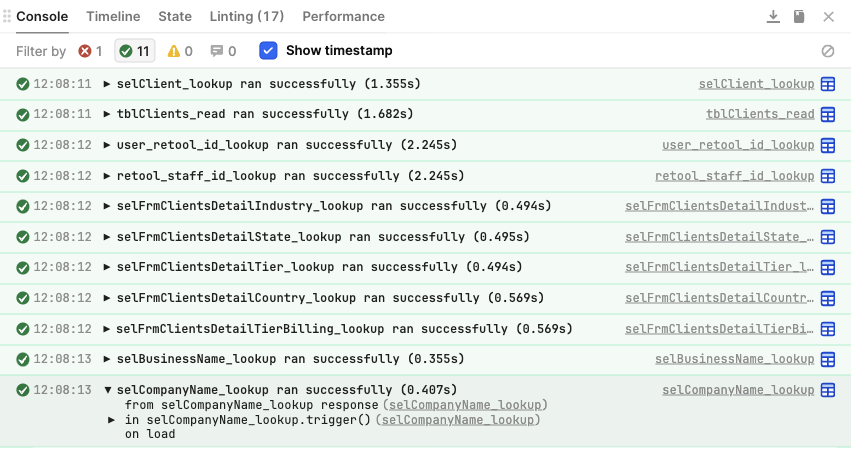
While using various parts of the app, look at every single query which appears in the debug console, specifically looking for duplicates which have been fired from different parts of the app. Trace those duplicate queries to the source using the dependencies information and change your code.
Look to see if you can set as many queries to manual as possible. This will require some code changes but might eliminate a lot of multiple query firing.
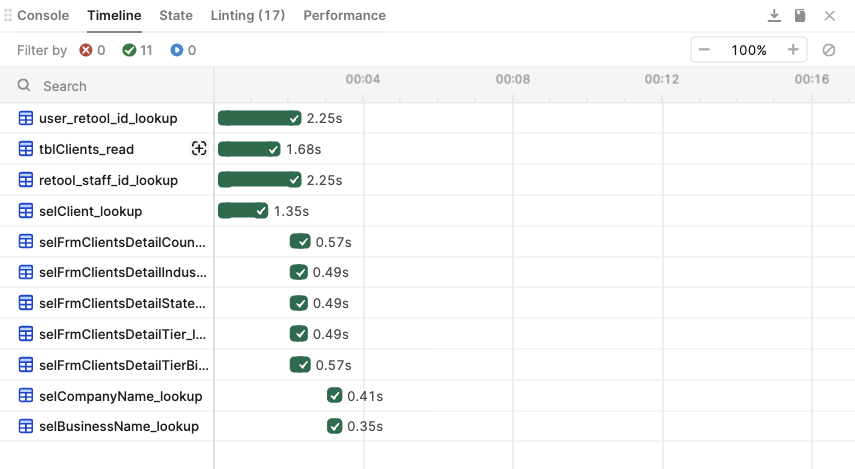
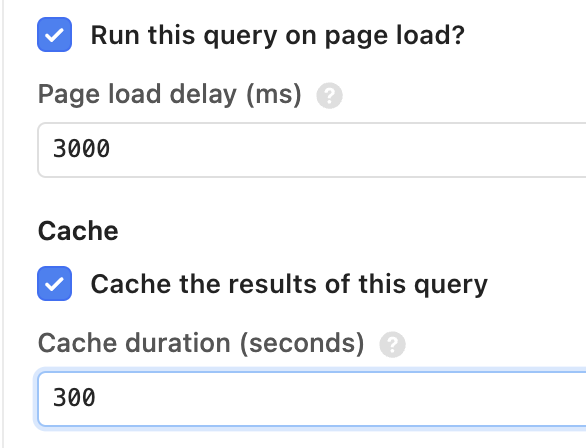
If the problem is exclusively on startup, look at the timeline and manually edit your query delays so they have say 1500ms gaps between groups of them.
Check the size of the data load coming from your tables. If you have a lot of columns with large text fields, then adding even a few rows will result in a larger payload, especially if you are using SELECT * FROM x
Piggybacking off of this topic. What are the resources if the above steps do not resolve performance issues? My Retool application is so sluggish it's nearly unusable. There are no redundant queries running, and all queries are triggered manually or by other events that are highly controlled. The same application when using staging data runs extremely fast - the difference is that the base data set is ~5k records in staging and ~17k records in production.
I suspect that the application is running out of memory due to dropdowns with thousands of possible options, but I don't see any way to confirm this with the resources available to me.
I'm not sure if this answers your question @Paulo, but the query that generates data for a dropdown is a simple select distinct . The query is only executed when the application is first opened or if an update is saved through the application, so it's not running redundantly. Of note, the query itself (as well as the query that generates the dataset for a table component) runs rather quickly.
A dropdown with thousands of options will definitely slow down your application. I would recommend using a table with enabled server side pagination. That way, we are pulling maybe 50-100 records for each page.
Can you provide more detail on this solution? Are you recommending replacing a drop down component with a table component, and using the selected rows from that table to filter another table?
It goes without saying that this would not be an ideal customer experience, as a dropdown takes up less space and is what end users expect to interact with. If I'm understanding your proposal correctly, do you have examples you can point me to where using a table in place of a dropdown maintains the same look and feel?
Thankyou to everyone who offered their insights into my performance issues.
There were a few things to implement, and whilst I think there is room for continued improvement, the performance is alot better than what it was.
I'll list the improvements made below for anyone else who needs them:
Using queries to populate select menu/dropdown boxes
In these queries, I was using SELECT* in the SQL query, which was totally unnecessary. Stripping the fields back to SELECT title, uuid FROM resource cut out a lot of data which wasn't needed.
Paginating the results
When I first set up the app, there were some DB tables which only contained about 30 records. This was okay to display, however when uploading a csv of over 1000 records, the UI quickly had a heart attack.
Using the pagination component, I was able to pass in the page number to the SQL query which was responsible for populating the List View component with data.
I would say the pagination has had the biggest positive impact on the overall performance and the two things I outlined were relatively quick to identify with the help of the community and implement and would encourage anyone else who has similar performance issues to my own to attack these two things first.