Retool Forum
Add labels to bar chart
💬 Queries and Resources
Tess
May 5, 2022, 8:51pm
4
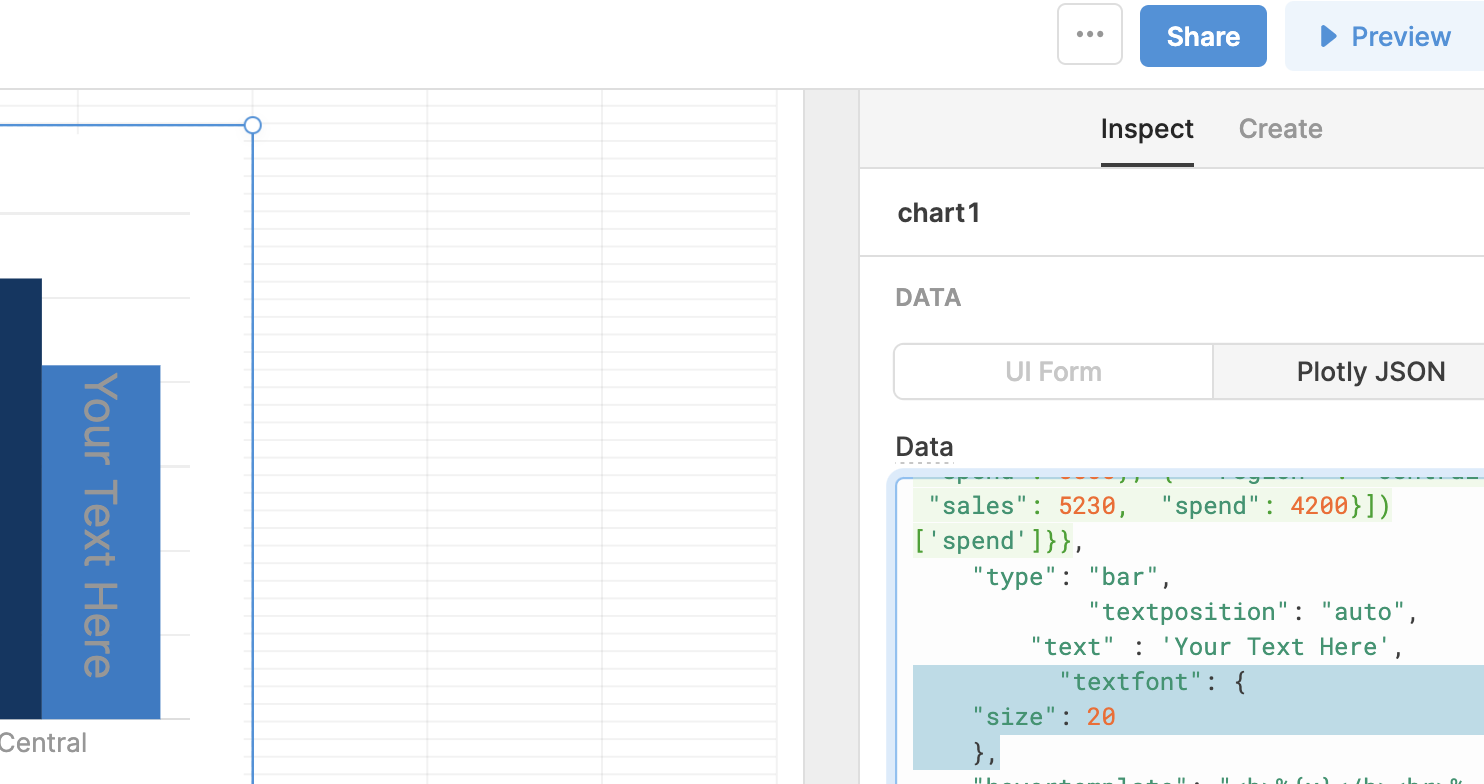
Hey there! This seems to work for font size:
"textfont": {
    "size": 20
    },
1484×784 60 KB
Filter chart by date
show post in topic
Related topics
Topic
Replies
Views
Activity
Rotate & reposition labels in bar chart
💬 App Building
annotated-text
,
plotly
4
2399
August 2, 2023
Bar+line chart data labels in line
💬 App Building
3
1753
August 2, 2023
How to Display Percentage Labels in Each Segment of a Stacked Bar Chart in Retool
💬 App Building
chart
,
data
,
plotly
3
453
December 20, 2024
Plotly charts cannot do horizontal bar charts correctly
💬 App Building
8
5687
August 2, 2023
Plotly Math for Labels (Billions, Millions, etc.)
💬 App Building
chart
,
design
,
plotly
5
1971
October 20, 2025